Below is a chart and brief excerpt from today's Early Look written by Hedgeye CEO Keith McCullough.
|
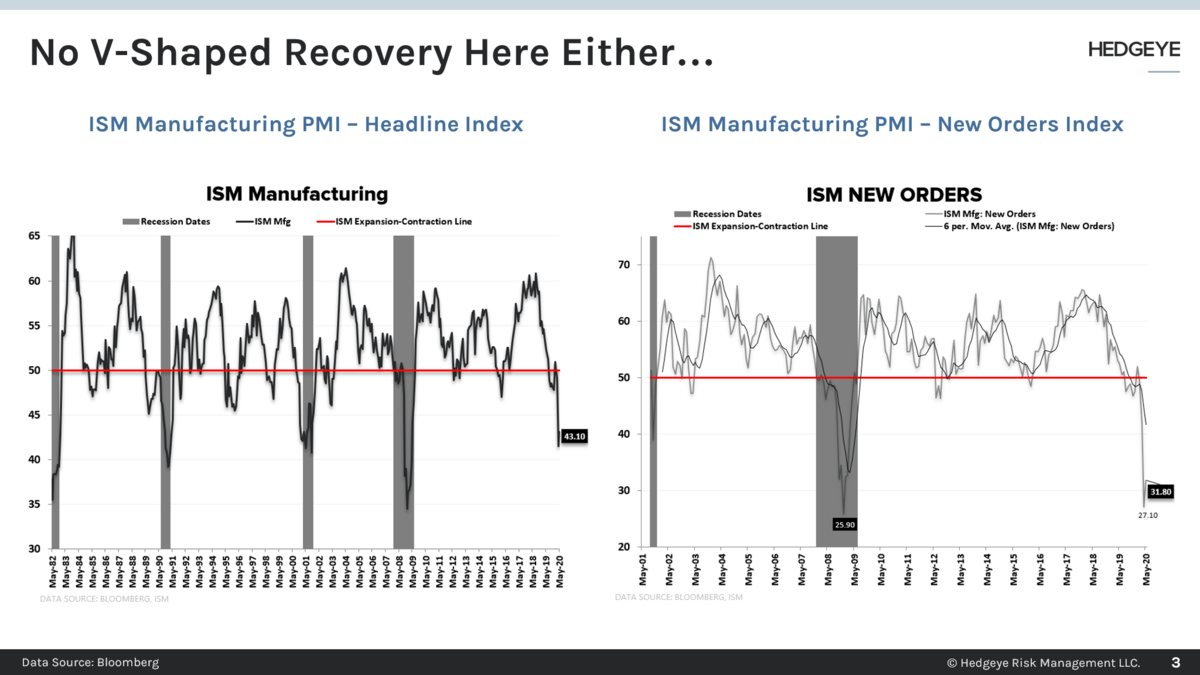
After we observe and orient around this short-term OODA Loop, the bigger question I need to answer from an Asset Allocation perspective is when to tilt from Deep #Quad4 into Deep #Quad3? For those of you who don’t know about the non-V-shaped recovery in the US economy: A) ISM for May bounced a whopping 1.6 points from the 41.5 low in April to 43.1 Using that picture instead of people’s FOMO “feelings” and words, that’s what DEEEEEEEEEEEEP looks like. When combined with A) high and rising unemployment and B) devaluing Dollars and raising the cost of living, that’s also called Deep State Stagflation. |