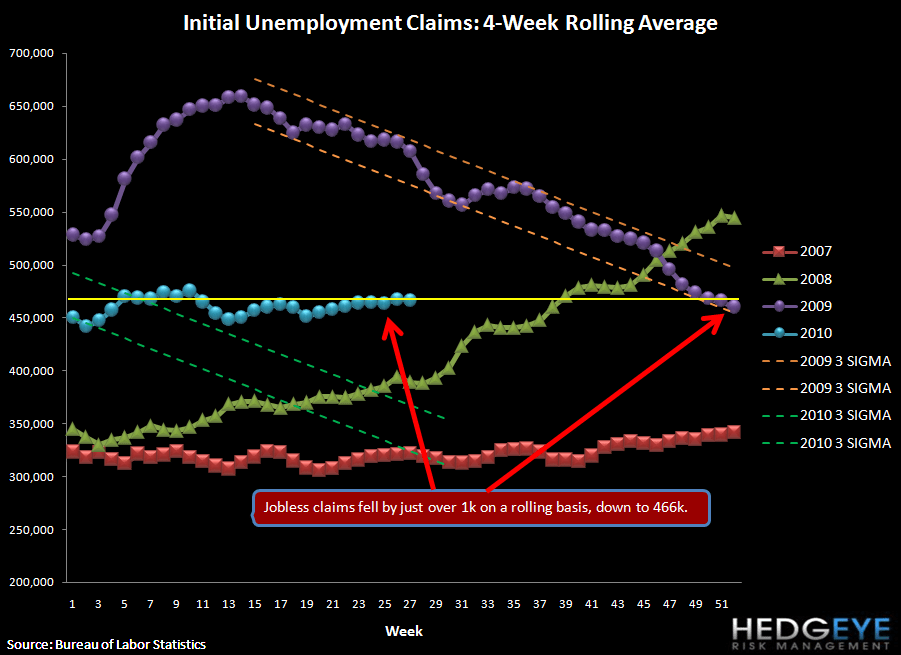
Initial claims this week fell 21k (18k net of the revision). This positive print continued the volatile pattern of the last four weeks, in which the week-over-week change has been more than 15k up or down each week. The four-week rolling average, which removes this volatility, decreased by 1k to 466k. For another week, claims remain in the 450-470k range they've occupied for most of the year, well above the 375-400k range needed for unemployment to materially improve.
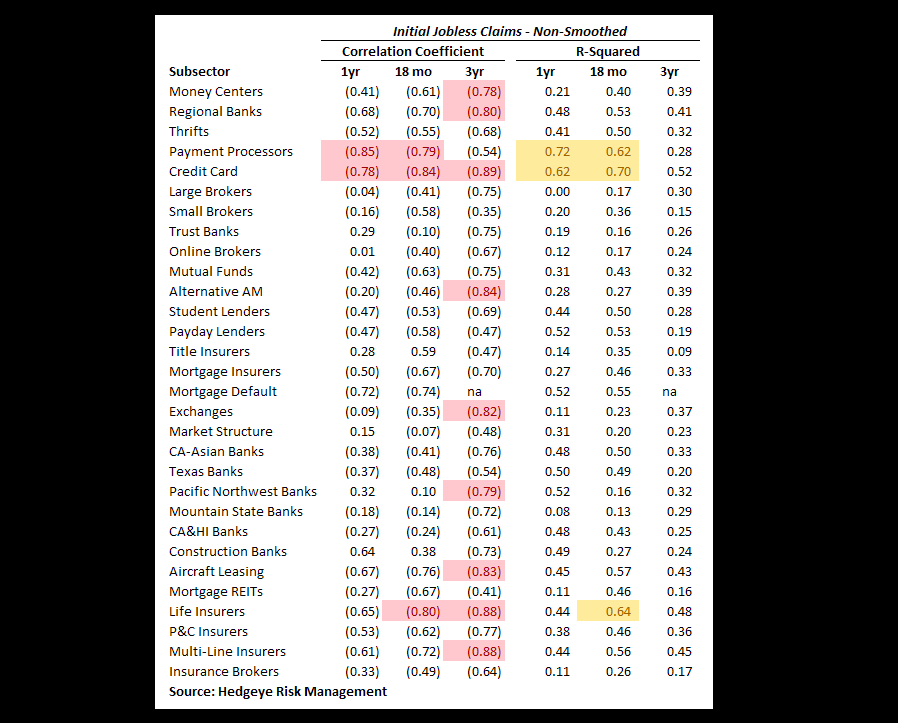
Below the jobless claims charts, we show the correlations between initial claims and each of the 30 Financial Subsectors. To reiterate, Credit Card and Payment Processing companies show the strongest correlations to initial claims, with R-squared values of .62 and .72 over the last year, respectively. Surprisingly, some subsectors show a positive correlation coefficient to initial claims - i.e. Financials that go up as unemployment claims go up. These names are concentrated in the Pacific Northwest Banks and Construction Banks, though these correlations are usually not very high.
In the table below, we found the correlation and R-squared of each company with initial claims, then took the average for each subsector. For composition of the subsectors, see Chart 5 below.
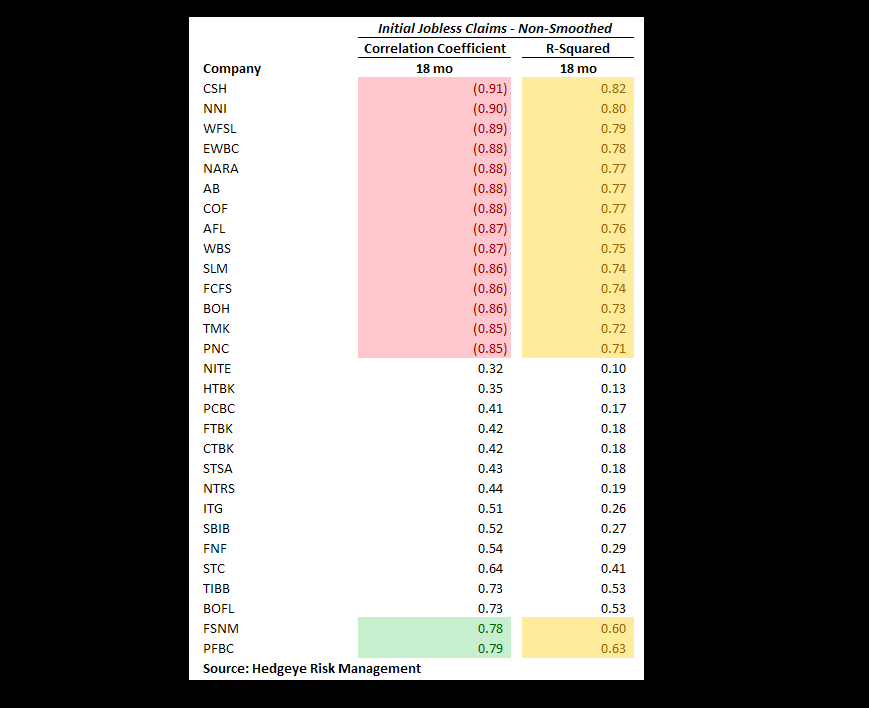
The following table shows the most highly correlated stocks (both positively and negatively correlated) with initial claims. Note that the top 15 negatively correlated stocks have a much stronger correlation on average than the top 15 positively correlated stocks - as you would expect, given that most of the Financial space is pro-cyclical.
As we've highlighted previously, astute investors will note that in some cases the R-squared doesn't seem to reconcile with the square of the correlation coefficient. This is a result of finding the correlation and then averaging. For example, Pacific Northwest Banks have an average correlation coefficient of .32 and an average R-squared of .52 (with CACB, CTBK, FTBK, and STSA strongly positively correlated and UMPQ strongly negatively correlated). The different directions have the effect of canceling out each other out when finding the average correlation coefficient, but do not cancel out when finding the average R-squared.
Below we chart the raw claims data.

The table below shows the stock performance of each subsector over four durations.

As was noted in last Friday's unemployment report, May was the peak month of Census hiring, and it should be a headwind to jobs from here as the Census winds down.

Joshua Steiner, CFA
Allison Kaptur
