Below is a chart and brief excerpt from today's Early Look written by Hedgeye CEO Keith McCullough.
|
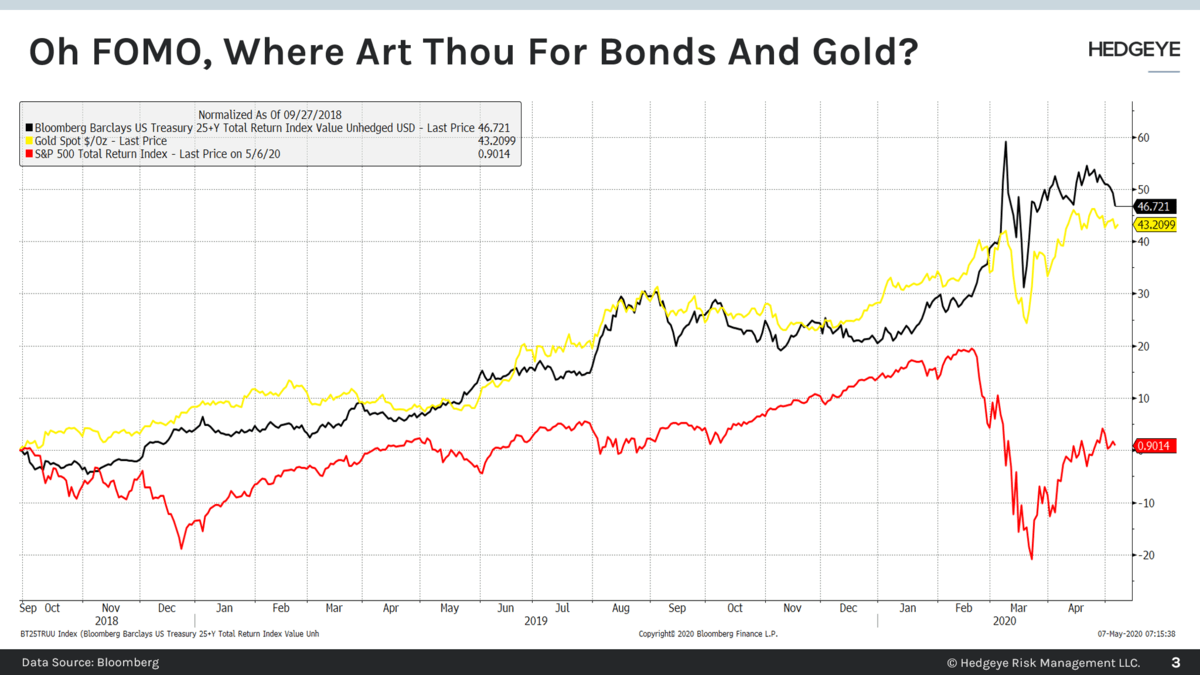
Other than one client call on the real-time matter, I had quite literally no Institutional Client questions on how big one should be going (grossing up long exposure) in both the Long Bond and Gold at the low ends of my Risk Ranges… But at last Wednesday’s lower-highs for the Russell 2000 and SPY? Oh my. My inbox was in Phase 14 of FOMO! You can see #NoFOMO in terms of Global Macro net positioning (non-commercial CTFC futures & options contracts): A) The net LONG position in the UST 10yr Bond is only 5,514 contracts (long +372,991 contracts is the 3yr high) |