Below are charts and brief excerpt from today's Early Look written by Hedgeye CEO Keith McCullough.
|
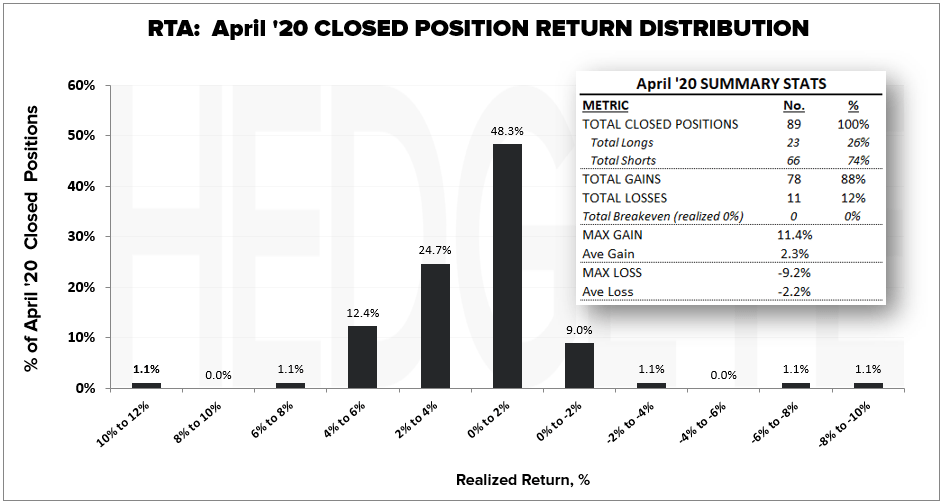
Yep, with the SP500’s +12.7% bear market bounce in April, I did better on the SHORT side than I did on the LONG side. For those of you who don’t like consistency (players who can bat for average) my MAX gains were greater than my MAX losses too. My MAX loss on the long side of -9.2% was actually a latent mistake I made buying what our Quad Map said I should buy during the crash in March: S&P Low Volatility (SPLV) exposure. It was a good example of something that didn’t work like it “should” have. Latent mistakes, or letting losers run, are some of the worst mistakes I ever make. It’s taken me a long time, lots of reps, and plenty of wine (at night when I remodel everything!), to get less bad at that part of The Game. Since I don’t play well using short-term stop losses, I’m well aware that I always run the risk of letting a loser run. In a perfectly timestamped world (think Madoff or anonymous people on Twitter), I’d let winners run and cut every loss quick. In the real-world, where I’m dumb enough to show all of Wall Street (and now Main Street) every single move I make, I do have to have some short-term patience on positions that A) go against me but B) make longer-term sense. |