Jobless Claims Better Week Over Week, But Remain at a Level Inconsistent with Material Improvement
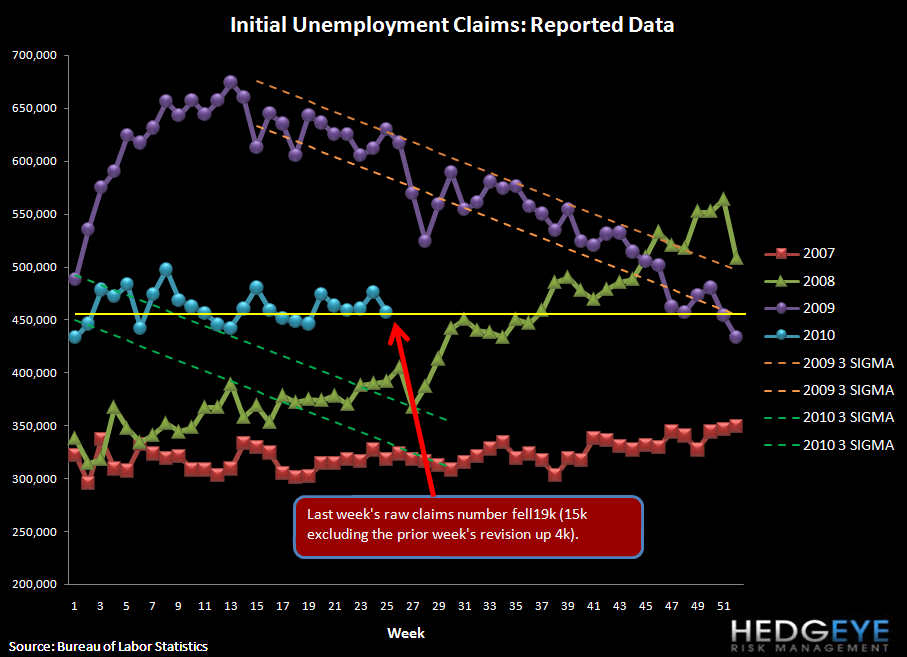
Initial claims fell week over week by 19k after upwardly revising the prior week by 4k, suggesting the actual improvement was 15k. More important to us is that the level of jobless claims - 457k - remains right in line with its trend year-to-date in the 450k-460k range. As a reminder, this level is too high for unemployment to materially improve. The level would need to be in the 375k-400k range by our estimates for unemployment to make real headway in the right direction. On a rolling basis, claims fell by 1.5k to 463k from 464.5k last week. On the margin, this morning's data is slightly positive, but it's only a small step in the right direction so we'll reserve our enthusiasm for the time being.

Below the jobless claims charts, we show the correlations between initial claims and each of the 30 Financial Subsectors. To reiterate, Credit Card and Payment Processing companies show the strongest correlations to initial claims, with R-squared values of .62 and .72 over the last year, respectively. Surprisingly, some subsectors show a positive correlation coefficient to initial claims - i.e. Financials that go up as unemployment claims go up. These names are concentrated in the Pacific Northwest Banks and Construction Banks, though these correlations are usually not very high.
In the table below, we found the correlation and R-squared of each company with initial claims, then took the average for each subsector. For composition of the subsectors, see Chart 5 below.

The following table shows the most highly correlated stocks (both positively and negatively correlated) with initial claims. Note that the top 15 negatively correlated stocks have a much stronger correlation on average than the top 15 positively correlated stocks - as you would expect, given that most of the Financial space is pro-cyclical.
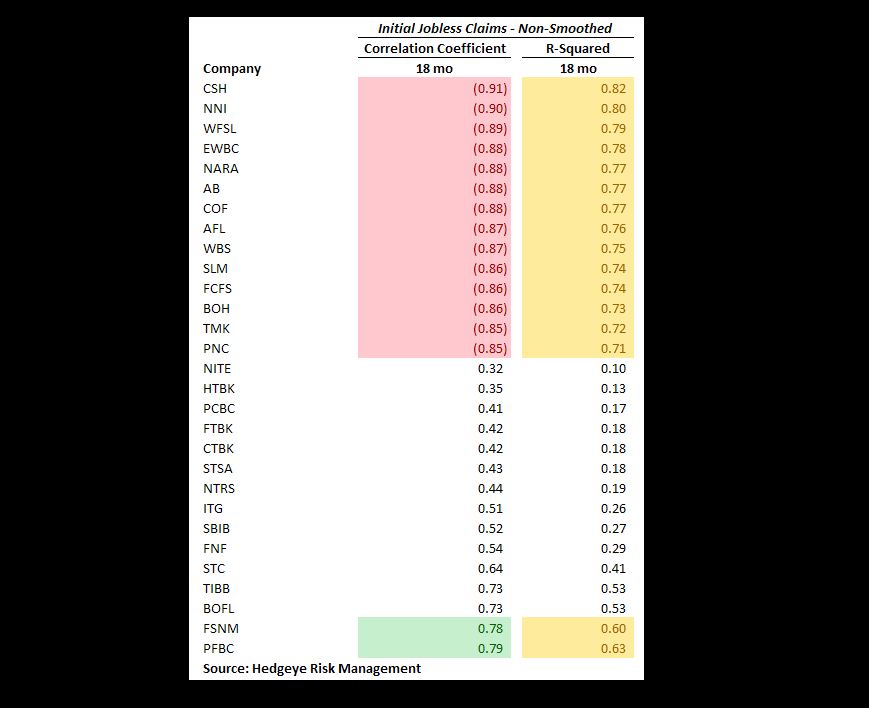
Astute investors will note that in some cases the R-squared doesn't seem to reconcile with the square of the correlation coefficient. This is a result of finding the correlation and then averaging. For example, Pacific Northwest Banks have an average correlation coefficient of .32 and an average R-squared of .52 (with CACB, CTBK, FTBK, and STSA strongly positively correlated and UMPQ strongly negatively correlated). The different directions have the effect of canceling out each other out when finding the average correlation coefficient, but do not cancel out when finding the average R-squared.
Below we chart the raw claims data.
The table below shows the stock performance of each subsector over four durations.

As a reminder, May was the peak month of Census hiring, and it should now be a headwind to jobs from here as the Census winds down.

Joshua Steiner, CFA
Allison Kaptur
