*** We've added subsector and company correlations to initial jobless claims later in this note. ***
Things Continue to Get Worse
For the last few months we've been growing incrementally more bearish for two reasons. First, we've become worried about the rising risk of a double dip in the housing market, which we'll be hosting a conference call on next week. Second, we've become cognizant of the lack of improvement in the employment picture. Since the start of this year, almost six months now, the number of people filing new unemployment insurance claims hasn't fallen one iota. Compare that with the almost straight line of improvement we saw from April 2009 through year-end 2009, where claims were falling at a rate of 23k/month. The reported number this week rose 12k to 472k, but that's after revising the prior week up by 4k so the real increase was 16k. Either way, the bottom line is that claims remain in the ~450-460k range. Rolling claims were actually flat at 463.5k vs 464k the prior week. As a reminder, we need to see initial claims fall to a sustained level of 375-400k in order for unemployment to fall meaningfully and, by extension, lenders' net charge-offs to return to normalized levels. We remain well above that level, but more importantly we're showing zero signs of progress moving to that level.
Below the jobless claims charts, we show the correlations between initial claims and each of the 30 Financial Subsectors. Not surprisingly, Credit Card and Payment Processing companies show the strongest correlations to initial claims, with R-squared values of .62 and .72 over the last year, respectively. Surprisingly, some subsectors show a positive correlation coefficient to initial claims - i.e. Financials that go up as unemployment claims go up. These names are concentrated in the Pacific Northwest Banks and Construction Banks, though these correlations are usually not very high.

In the table below, we found the correlation and R-squared of each company with initial claims, then took the average for each subsector. For composition of the subsectors, see Chart 5 below.

The following table shows the most highly correlated stocks (both positively and negatively correlated) with initial claims. Note that the top 15 negatively correlated stocks have a much stronger correlation on average than the top 15 positively correlated stocks - as you would expect, given that most of the Financial space is pro-cyclical.

Astute investors will note that in some cases the R-squared doesn't seem to reconcile with the square of the correlation coefficient. This is a result of finding the correlation and then averaging. For example, Pacific Northwest Banks have an average correlation coefficient of .32 and an average R-squared of .52 (with CACB, CTBK, FTBK, and STSA strongly positively correlated and UMPQ strongly negatively correlated). The different directions have the effect of canceling out each other out when finding the average correlation coefficient, but do not cancel out when finding the average R-squared.
Below we chart the raw claims data.

The table below shows the stock performance of each subsector over four durations.

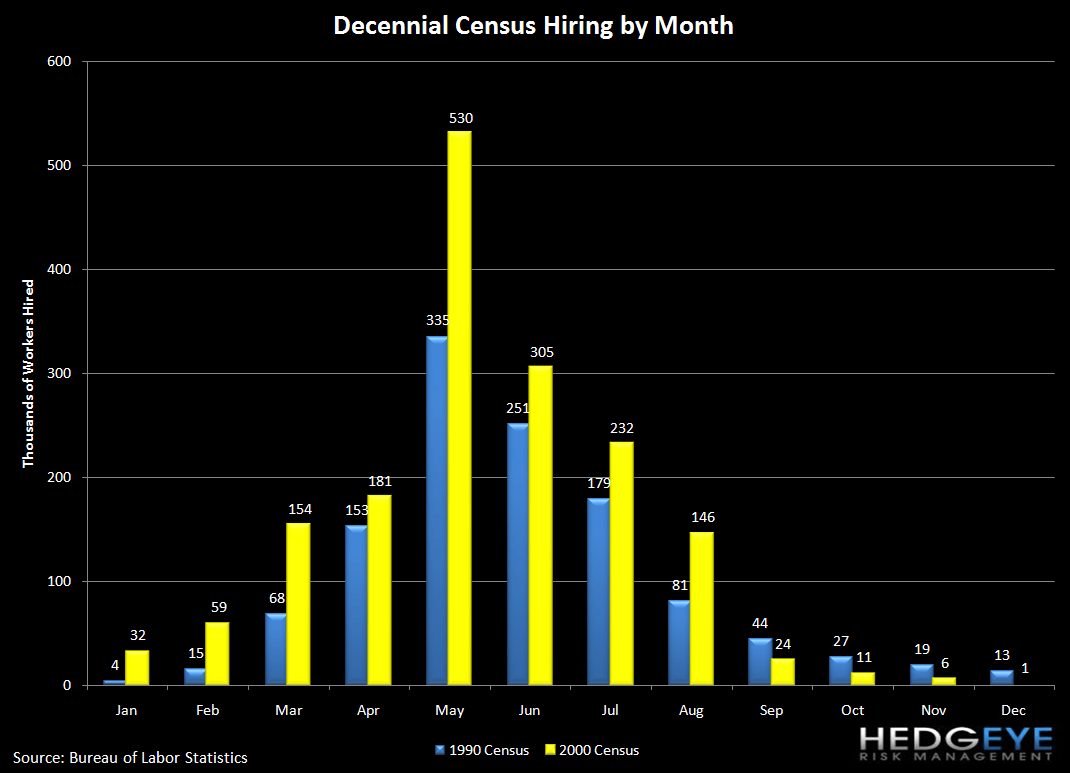
As a reminder, May was the peak month of Census hiring, and it should now be a headwind to jobs from here as the Census winds down.
Joshua Steiner, CFA
Allison Kaptur
