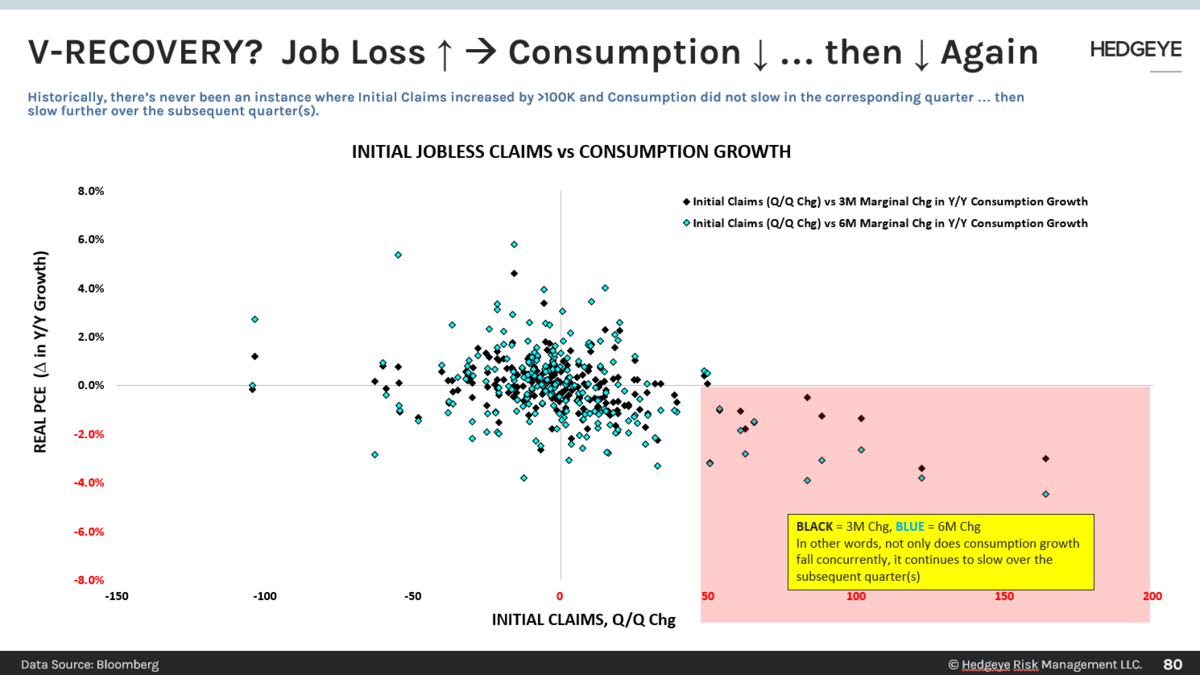
CHART OF THE DAY: Initial Jobless Claims vs. Consumption Growth
03/26/20 08:05AM EDT
Below is a chart and brief excerpt from today's Early Look written by Macro analyst Christian Drake.

|
The “interesting” offensive will only escalate as it storms the domestic labor beachhead this morning.
This has been well covered and we’ve been detailing the state-level announcements since last week but with Initial Claims set to print between 1.5-4.5 million, the job loss blitz is really all that matters, no matter how ubiquitous the coverage has been:
- Consensus is at 1.5 million, which is probably low.
- Regardless of where it prints exactly, the employment loss will be catastrophic and multiples of anything “since ever”.
- At the median of the estimated range, the number of unemployed would rise by ~60% and push the Unemployment Rate up ~2 percentage points … which, again, would = the most “since ever”.
- As the Chart of the Day illustrates, historically, when claims increases by >100K, consumption growth always slows …. and then slows again in the subsequent quarter(s). Same for Investment.
|

© 2024 Hedgeye Risk Management, LLC. The information contained herein is the property of Hedgeye, which reserves all rights thereto. Redistribution of any part of this information is prohibited without the express written consent of Hedgeye. Hedgeye is not responsible for any errors in or omissions to this information, or for any consequences that may result from the use of this information.