Below is a chart and brief excerpt from today's Early Look written by Hedgeye CEO Keith McCullough.
|
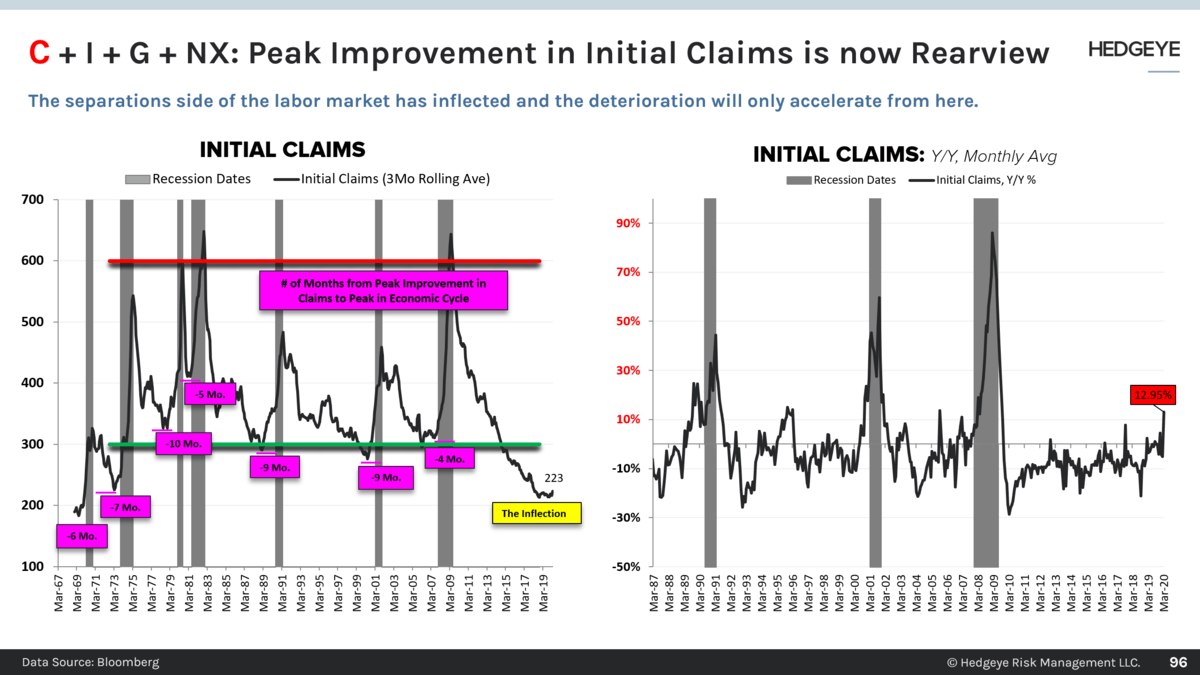
Starting with the Quad Map, we’re about to enter (within a week) the deepest of ROC (rate of change) #Quad4 Phase Transitions we’ve seen in the US Labor Cycle probably ever. Yep, ever is a very long time, so instead of “nibbling” on the next narrative about the “lows being in” because people who blew up their hedge fund with leverage sold a short-term low, I humbly submit that you pay attention to today’s Chart of The Day: US Jobless Claims. At this stage of the US economic cycle, when jobless claims bottom and hook higher, they go way higher, faster, than any perma bull of the early, mid, and late cycle can believe. Most of the new cattle class of bulls have never seen this part of The Cycle before. This is the eye of the storm and yesterday was the 1st shot across the labor market bow: A) Initial Jobless Claims: +70k to a 4yr high of 281k in the week-ended 3/14B) Monthly Average Initial Claims: +1,806bps to +12.95% YoY in MAR – the fastest ROC since SEP ‘09 Don’t confuse SEP 2009’s pace with the MAR 2008, then JUL 2008 pace. It’s where you #accelerate from the cycle low (in 2000 and 2007) in that chart that matters. Even the Moving Monkeys will be scared of these “technical” breakouts. |