Editor's Note: Below is complimentary access to a research note sent to Hedgeye subscribers yesterday.

Global stock markets have lost $3.9 trillion in total market cap in the past 26 trading days. In the U.S. alone, aggregate stock market value has dropped by $1.75 trillion.
While most investors are freaking out around the globe, our subscribers are sleeping very well!
The mainstream media says the recent stock market selloff was caused by an intensification of Coronavirus fear. Sure, shocks like the Coronavirus impact financial markets, but dig deeper and you’ll find that financial markets were perfectly primed for a pullback. COVID-19 was simply a tipping point.
Below is a detailed report on what’s going on and what to prepare for going forward.
(You can also get a free month of The Macro Show no strings attached, no credit card entered. Click here to get it.)
Full Cycle Investing: Modern Day Risk Management
We frequently remind our subscribers that modern day risk management requires a more holistic, unemotional and pragmatic mindset. In other words, the opposite of what you get if you’re wasting your time watching CNBC.
Your asset allocation should be anchored to high probability outcomes. The goal is building wealth and weathering financial market drawdowns throughout the economic cycle. It’s not about riding the S&P 500 to procyclical all-time highs, then giving it all back in a selloff. True alpha generation requires more diligence than that.
That’s why we call our unique process, Full Cycle Investing.
Our risk management approach is designed to help you tilt your portfolio toward the likely outperformers, while avoiding the underperformers across the entire landscape of asset classes – equities, fixed income, foreign exchange and commodities.
It’s about a lot more than “stocks.”
Were You Prepared For This Drawdown?
We were warning investors about financial markets pulling forward #Quad4 risk over the past few weeks.
What’s Quad 4?
Our proprietary Growth, Inflation, Policy (GIP) model separates the economy into four distinct regimes (we call them “Quads”) which correspond to marginal rates of change of growth and inflation, which are two of the three principal components for predicting forward-looking asset returns.
The third – monetary policy – is accounted for in our analysis by overlaying how central bankers are most likely to respond to implied changes in economic conditions.
Each is assigned a “quadrant” in our GIP model and the typical government response as a result (neutral, hawkish, in-a-box or dovish):
- Growth accelerating, Inflation slowing (QUAD 1)
- Growth accelerating, Inflation accelerating (QUAD 2)
- Growth slowing, Inflation accelerating (QUAD 3)
- Growth slowing, Inflation slowing (QUAD 4)
If you look at the back-test, market history suggests the rate of change in growth and inflation are the most causal factors for forecasting future market returns (see chart below). That’s why if you can accurately predict growth and inflation, you’re able to understand the market environment you’re in and proactively prepare yourself across asset classes, style factors and factor exposures. (We run the GIP process for the top 50 economies around the globe.)
As you can see in the chart below, Quad 4 is an environment in which the rate of change of growth and inflation are slowing. Historically, this Quad 4 environment has been negative for risk assets, hence the recent selloff (as well as additional contributing factors which we’ll dig into below).
Wall Street is not prepared for a slowdown in U.S. growth.

Quad 4 Investing Playbook: Asset Allocation
Quad 4 economic regimes have historically proven negative for the broader equity market, but specifically the high-flying, momentum driven sectors like Technology (XLK) and small caps like the Russell 2000 (IWM). Meanwhile, defensive sectors like Utilities (XLU), REITS (VNQ) and Consumer Staples (XLP) are outperformers.
Sticking with the equity side, as the Market transitions into #Quad4, here are the Top 3 Factor Exposure Shorts/Underweights:
- Momentum
- High Beta
- Secular Growers
Here are 3 of the Top 4 Factor Exposure Longs/Overweights that you should be buying on dips in #Quad4:
- Low Beta
- Dividend Yield
- Quality
Outside of equities, Treasury bonds (TLT and SHY) and Gold (GLD) are core long allocations. Given Quad 4’s negative implications for risk assets, it’s no surprise that High-Yield Credit (JNK) is also a great allocation on the short side.
Finally, rounding out the Quad 4 asset allocation is foreign exchange, where you want to be long U.S. Dollars (UUP), because it is a dominant global reserve currency and is structurally in demand in a liquidity crunch.
The U.S. has been in persistent Growth Slowing mode since Q4 2018. This explains why Gold (GLD), Treasury bonds (TLT), REITS (VNQ) and Utilities (XLU) have been our core long ideas since then.
Here’s the performance since September 28, 2018:
- Gold (GLD): 35.9%
- Utilities (XLU): 29.2%
- Treasury bonds (TLT): 28.8%
- REITS (VNQ): 18.4%
Versus…
- S&P 500: 7.3%
- Dow: 5.9%
- Russell 2000: -7.3%
Growth slowing allocations have been beating U.S. equities for some time now.

What’s Your Edge? Our ‘Risk Management A | B Test’
While it’s not yet Q2 of 2020 (i.e. our Quad 4 in Q2 forecast), in the past few weeks our other risk management signals have been picking up a significant sea change within financial market internals.
There are two core components of the Hedgeye risk management process. We call this process our “Risk Management A | B Test.”
Here are the two components…
- Economic data: What is the current economic outlook (based on our fundamental research and Growth, Inflation, Policy (GIP) model)?
- Market signal: What environment is the market pricing-in right now (based on Hedgeye CEO Keith McCullough’s Trade-Trend-Tail/Risk Range model)?
We’ve already described the cyclical component of this process – measuring and mapping the U.S. economy using our GIP model – where our Quad 4 outlook already held a dim view for risk assets.
Now let’s incorporate the financial market signal.
Risk Ranges: Financial Markets Pulling Forward Quad 4 Risk
Currently, our Risk Range model is spotting critical breakdowns and breakouts across global asset classes. All of these signals taken together suggested financial markets are pricing-in our Quad 4 outlook right now.
Here are a few notables with the current market trend noted:
- 10-Year Treasury Yields: BEARISH TREND
- Russell 2000: BEARISH TREND
- VIX: BULLISH TREND
- U.S. Dollar Index: BULLISH TREND
- WTI Crude Oil: BEARISH TREND
- Gold: BULLISH TREND
Why is this important?
Our Risk Range and Trade-Trend-Tail process was developed by Hedgeye CEO Keith McCullough while working as a portfolio manager at Magnetar Capital in the mid-2000s.
In Keith’s early days running a long-short portfolio at Magnetar, a risk management policy set by the firm would often neuter Keith out of positions. He developed his Risk Range process to try to stay ahead of and front run big changes that the risk systems started to spit out, things that would ran counter to his positioning.
You may recall the Magnetar team came out of Citadel in the mid-2000s and pioneered techniques now considered “best practices” by today’s hedge fund industry – particularly how to operate market neutral and manage factor exposure risk. JPMorgan estimates that these systematic trading strategies now account for 90% of U.S. equity trading volume.
In other words, financial markets are more sensitive than ever to Macro risk, which explains why the forward pricing in of Quad 4 (precipitated by COVID-19) has been so violent.
Keith’s quantitative Risk Range process uses price, volume and volatility at the index or ticker level to generate a probable range for that security over the short to intermediate-term. For example, if you’re looking at the S&P 500, the Risk Ranges suggest where you want to be buying (at the low end of the probable range) and selling (at the top end of the range).
Again, using the underlying price, volume and volatility of an asset, this proprietary signal also suggests critical thresholds, across different durations to help you identify Bullish and Bearish “phase transitions” – effectively helping you identify breakouts and breakdowns across specific assets.
That’s why recent breakouts in the U.S. Dollar, Treasuries and Gold alongside breakdowns in Oil, Technology stocks and global equity markets more broadly signaled to us that all was not right in financial markets.
You marry this with significant trends percolating in futures and options markets these past few weeks and it further confirmed what we already thought: That Quad 4 risks were resurfacing, and Wall Street wasn’t prepared.
Financial Market Sentiment: Complacency & Capitulation
Consider recent trends in “implied” versus “realized” volatility.
“Implied volatility” is a measure of the market’s expectations of future volatility based on investor positioning in the futures and options market over some given time period. This is measured relative to “realized volatility,” i.e. historical volatility over the same time period.
An implied volatility discount relative to realized volatility, at its most extreme level, around a particular asset suggests complacency (on the long side) and capitulation (on the short side). Conversely, an extreme implied volatility premium suggests fearful investor positioning around that asset.
Just look at U.S. equity markets. Isolating that part of that Global Macro Market’s positioning revealed absolute complacency by bulls and capitulation by bears between FEB 13th and FEB 18th when:
- SPY’s implied volatility dropped to a -6% to -8% DISCOUNT vs. 30-day realized volatility and …
- Tech’s (XLK) implied volatility collapsed to a -8 to -11% DISCOUNT vs. 30-day realized
Post a 4-day smackdown in “risk” (and an epic ramp for Treasuries and Gold), here’s where equity market is pricing risk:
- SPY’s implied volatility ripped to a +34% PREMIUM vs. 30-day realized volatility and …
- Tech’s (XLK) implied volatility ramped to a +19% PREMIUM vs. 30-day realized
What does that mean? After capitulating on shorts and getting levered long between February 13th-18th, consensus positioning reflects bidding up “protection” AFTER a more than 7% SPY correction.
Wall Street gross hedge fund exposure to the S&P 500 was in the 95th percentile of 1-year readings.

What Comes Next? The Fed Isn’t Dovish Enough
Perpetuating many of these dynamics is a Federal Reserve that still isn’t dovish enough relative to our dour economic outlook. That’s what financial markets, in particular U.S. Dollar strength, are telling you right now.
The Fed cut rates three times in 2019, but in its previous two meetings has held rates steady signaling at its January meeting that the “current stance of monetary policy was appropriate.” The next Fed meeting is between March 17-18, in which Wall Street is pricing in a 32% probability of a rate cut.
Unless the Fed takes a more dovish stance, the pressure of U.S. Dollar strength will continue to tighten financial conditions globally and actually exacerbate already challenging Quad 4 conditions (in both the U.S. and China).
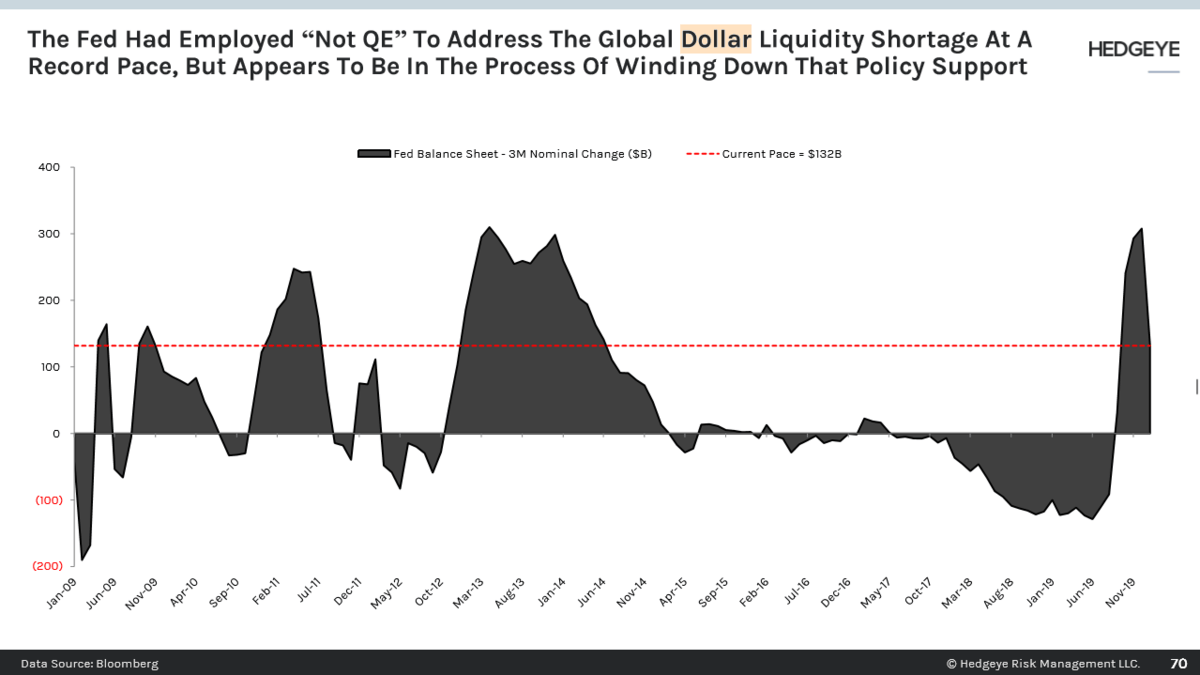
The Fed was confronted with the challenges of U.S. Dollar strength in October of 2019 a strong dollar exacerbated the dollar shortage and impaired the repo markets. The Fed attempted to alleviate repo market stress by performing “not QE,” balance sheet expansion.
But the Fed is now putting themselves in a position where if they don’t do more balance sheet expansion and the data doesn’t cooperate (i.e. Quad 4 economic conditions persist) , it will effectively be a monetary tightening into a slowdown.
Ironically, the Fed might even be the next catalyst for further U.S. economic weakness. Powell & Co. already have an April target date to think about winding down the pace of “not QE” balance sheet expansion. (As a reminder, the U.S. Dollar strengthens in Quad 4. The U.S. Dollar Index is up +2.8% already in 2020.)
Investors may recall what happened to financial markets the last time the Fed tightened into a slowdown at the end of 2018. The S&P 500’s performance in December 2018 was the worst December since the Great Depression.
We don’t think the Fed is dovish enough. That’s why we’re sticking with our preferred Quad 4 exposures.

A Closing Note About Quad 4 Risk
Notice how the analysis above doesn’t mention the coronavirus?
Modern day risk management isn’t about making “big bang” market calls. It’s about diligently measuring and mapping economic data on a daily basis. Understanding market structure. Identifying trigger points. Making a high probability investment conclusion.
Imagine a sand pile. Each grain of sand dropped from above adds to the size of the pile, but also contributes to its overall instability. Eventually, the last grain of sand falls that collapses the pile.
Risk accumulates much like grains of sand. Put more succinctly, as Hedgeye CEO Keith McCullough likes to say, “Risk happens slowly then all at once.” Coronavirus is obviously a big risk to financial markets. But the overall instability of financial markets has been building for some time.
Our goal is to keep you proactively prepared before the sand pile collapses.
-Hedgeye

