Below is a chart and brief excerpt from today's Early Look written by Hedgeye CEO Keith McCullough.

|
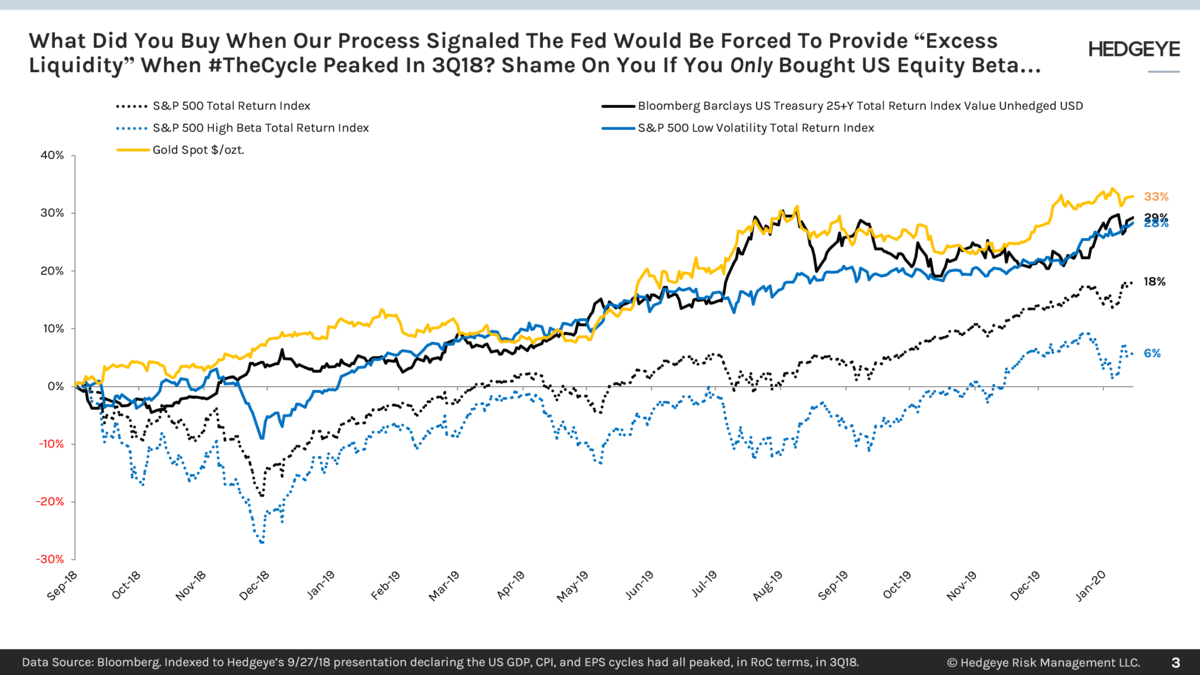
Being a loser is different than losing an opportunity to learn something. I know, with 100% certainty, that I will get something wrong today. What I don’t know is why I’ll get it wrong. Both new market moves and incoming data will determine that. My Bullish @Hedgeye TREND signal on SPY hasn’t been wrong. It’s been right. It’s also been more right to be long a Full Investing Cycle portfolio of Treasuries, Gold, Utes, REITS, and Housing stocks vs. SPY going back to when we made that asset class rotation call in Q418. For me at least, it would also be wrong to wakeup later than my competition, look at the SPY Futures, and actually “feel” something. |