CHART OF THE DAY: Do You Believe In Full Cycle Investing?

02/03/20 07:31AM EST

Below is a chart and brief excerpt from today's Early Look written by Hedgeye CEO Keith McCullough.

CHART OF THE DAY: Do You Believe In Full Cycle Investing? - 02.15.2018 investing styles cartoon  3

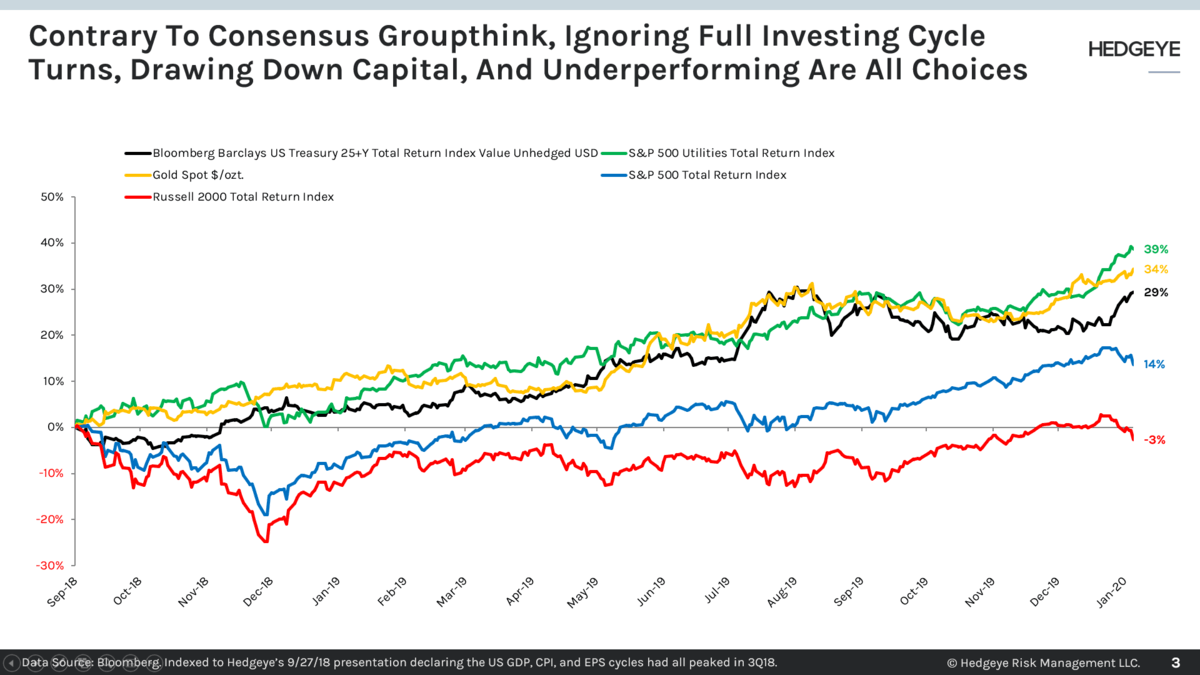
What did the market believe you should be Long in #Quad4 last week:

  1. Long Treasuries, across The Curve, with both the UST 2 and 10yr Yield down -18 basis points last week
  2. Long Gold which was up another +0.6% last week taking its Full Cycle Investing return (from Q3 of 2018) to +32.1%
  3. Long Utilities (XLU) which were +0.9% last week taking their Full Cycle Investing return to +34.6%

Do you believe in Full Cycle Investing? Since I made that up, you’d have to believe me and my teammates on that. I only believe in that because both the economic data and market returns do.

If you’re up +32-35% in Gold and/or Utilities since The US Cycle peaked in Q3 of 2018, you believe Old Wall draw-downs of your hard earned capital can’t hurt all of your capital too.

The alternative belief system was to buy something like “Small Caps” which were not only down -2.9% last week (Russell 2000) but are down for 5 of the last 6 weeks and down -7.2% over the same Full Cycle Investing period (Q318-Q120).

CHART OF THE DAY: Do You Believe In Full Cycle Investing? - Chart of the Day

© 2024 Hedgeye Risk Management, LLC. The information contained herein is the property of Hedgeye, which reserves all rights thereto. Redistribution of any part of this information is prohibited without the express written consent of Hedgeye. Hedgeye is not responsible for any errors in or omissions to this information, or for any consequences that may result from the use of this information.