Editor's Note: Below is a complimentary edition of today's Early Look.

kEY tAKEAWAY
|
THE BIG PICTURE
Phew. It’s a good thing the reporter at the Old Wall Journal supports the narrative of one of the world’s most widely owned “stocks.” Maybe 2& 20 for the note and the consensus long idea? Google’s Short Interest is 0.87%.
After reporting a big EPS miss of $10.12/share vs. $12.32 “expected”, what could possibly go wrong?
I know, I know. As long as the “stock doesn’t go down much on the news” into month-end from the all-time closing high in SPY, it absolutely has to be bullish. Who in their right mind would sell a “secular grower” that has been signaling Bullish @Hedgeye TREND since their last EPS print?
Assuming everyone who knows everything about secular growing understands cyclical secular slowing…
GOOGL was a secular grower when the US stock market finally put in its cycle peak back in OCT of 2007 (GOOGL’s cycle peak price was NOV 1, 2007). Pre its -58% crash to its lows in OCT of 2008, no one in rear-view mirror land was worried much about my forward outlook then either.
MACRO GRIND
Good morning from Boston, Massachusetts where I’m on Day 2 of Institutional Client meetings. It’s a great time to be on the road.
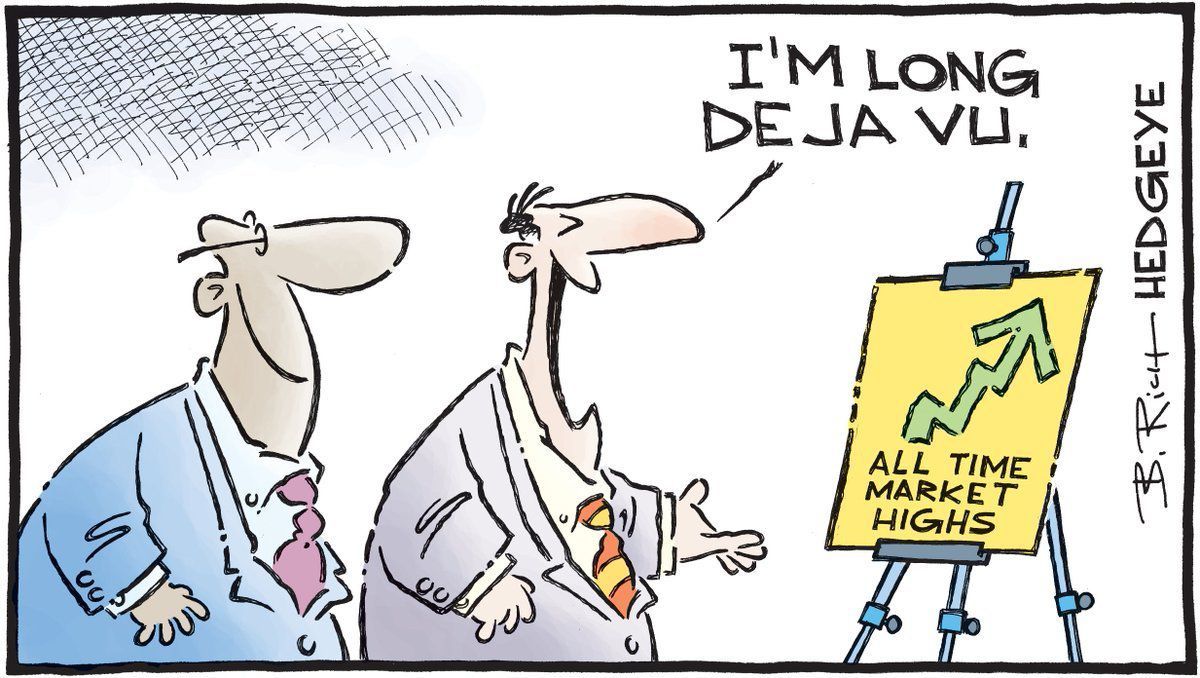
While I’m on the road, nothing about my #process changes. I write down closing macro market prices (and dabble in a few notes about single “stocks” that are timely/topical). I’ve been doing this for 20 years now… and have written down plenty of all-time closing highs. #ATH
While GOOGL probably won’t make an all-time high today, the SP500 did yesterday. I remember writing down the all-time closing highs for SPY in October of 2007 like it was yesterday. I got fired on November 2nd of 2007 for being “too bearish.” That was the top.
As I often remind myself, “tops are processes”, not points. The Cycle top for the Russell 2000 was on AUG 30th, 2018 (it’s still down -10.9% from there, but don’t tell anyone about that). The all-time tights for corporate credit spreads were in Q1 of 2018.
I know the Dow (in points) crowd wants to talk US story “stocks”, but in Global Equity market terms, most tops weren’t when the Russell topped. China, Europe, EM, etc. all put in their cycle highs when corporate credit spreads put in their tights….
That was all back in Q1 of 2018. Global Bond Yields crashed from there… and now a few tweets on “Phase 1” deals has the US FOMO in full force, into month-end, if only because it’s a career risk management decision for many PM’s to chase “YTD” performance bogeys.
“But look at how well AMZN and GOOGL act” on the companies reporting what, for the life of me, I can’t find in any of the bulls projections for the actual fundamentals 3-6 months ago… no process or style drift there, no worries.
And don’t look at the Beyond Bubble Burgers (BYND) and/or Software “cloud” bubbles imploding all the while…
Per the deep AI level analysis in the OWJ this AM, GOOGL is “making good investments to remain the world's most popular search engine and grow its cloud-computing business.”
Sounds really secularly cool, unless the company is ramping spending into a cyclical Software/Demand slow-down.
Again, I’ve been Bullish @Hedgeye TREND on GOOGL for a long time now (all of my FAANG Risk Ranges and Bullish/Bearish TREND views are published daily for all forward looking #timestamp fans to see).
But, post the month-end markups, why would I buy that stock today after?
A) Revenues in lineB) A clean cut EPS miss … and AFTER
C) A great run to lower-all-time highs (GOOGL peaked at month-end APR 2019 at $1296/share)
Into what are increasingly difficult Software/Cloud Revenue compares into 1H of 2020 pre the next appearance of a #Quad4 on the Hedgeye Quad Map in Q2 of 2020?
For now, I’d rather keep buying what consensus isn’t long: Cattle (COW) and Cocoa (NIB) = “secular” consumption longs since the caveman.
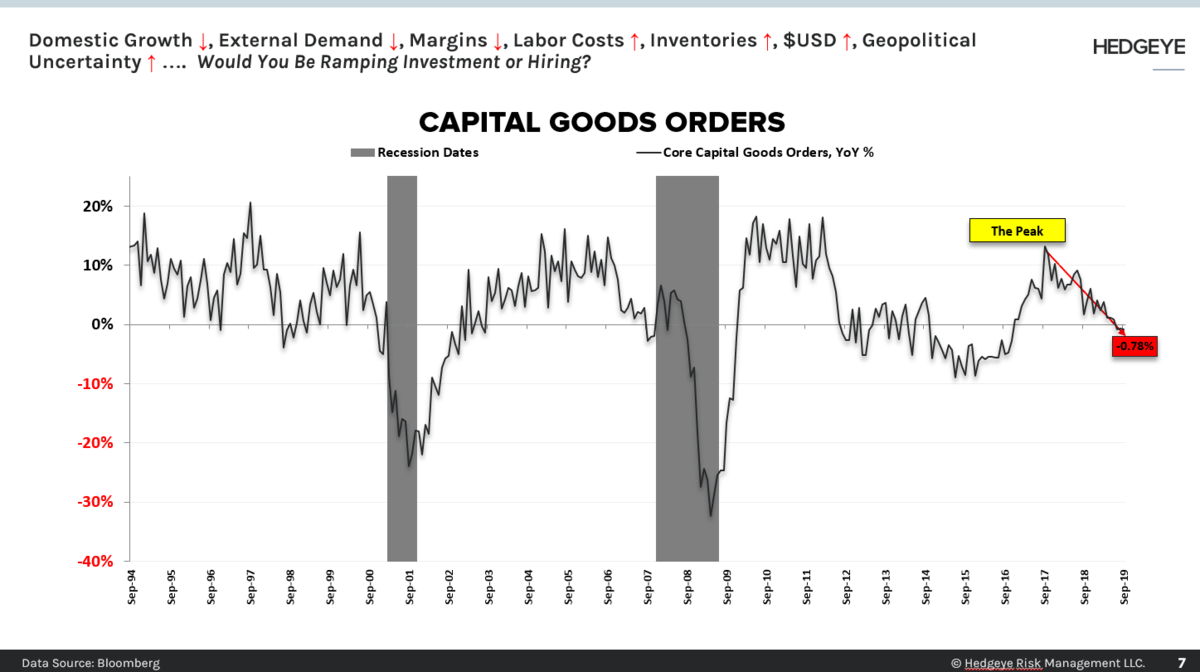
Why? During #Quad3 I want to be long INFLATION ACCELERATING, not the bloated cost structures of companies that:
A) Continue to see LABOR costs ramp to new cycle peaks … and
B) Have a rising probability of post #BeanDeal REVENUE slow-downs (and misses)
To be clear, no cycle peak is the same… but some of them certainly have what fractal math fans call Similar Sets. The combination of US COSTS (inflation) rising and REVENUES slowing is very OCT 2007. I don’t have to make the 2008 “call” again to see that in my notebooks. Google it.
Our Levels
Our immediate-term Global Macro Risk Ranges (with intermediate-term TREND signals I brackets) are now:
UST 10yr Yield 1.68-1.87% (bearish)
SPX 2970-3047 (bullish)
RUT 1471-1564 (bearish)
USD 96.79-98.07 (bullish)
Oil (WTI) 52.24-57.40 (bullish)
Gold 1474-1509 (bullish)
GOOGL 1226-1289 (bullish)
NFLX 262-294 (bearish
Best of luck out there today,
KM
Keith R. McCullough
Chief Executive Officer