
Dear Investor,
In late 2007, I experienced one of the most jarring experiences of my life.
I got fired.
Just six months prior, I thought I’d landed the opportunity of a lifetime. I had just been named portfolio manager at multi-strategy hedge fund Carlyle-Blue Wave – the private equity giant Carlyle’s only hedge fund at the time.
Then, in the summer of 2007, the Carlyle-Blue Wave credit team blew up. It was an early warning sign on many levels – of the Great Financial Crisis (and my imminent firing).
One-by-one, people around me lost their jobs. By mid-2008, Carlyle had closed Carlyle-Blue Wave forever, but I’d been long gone by then. I was bearish on the U.S. economy throughout the Summer of 2007 and, even as the economy ebbed closer and closer to the Great Recession, I was too early to the short side.
In November 2007, Carlyle sent me home with a box of my things – my notebooks, some shoes, and everything else. Risk happens slowly then all at once.
Five days after being fired my son was born. Nothing sharpens the mind like the existential feeling of being a new father with no job. As I started thinking about what to do next, the seminal moment came when my mom asked me, "How do you change the world with your job?"
Out of that, Hedgeye was born in 2008.
I tell that story today because I believe we’re at an important juncture in financial markets.
Back when I was bearish in the summer of 2007, I’d made the classic mistake of being right on my market outlook, but wrong on the timing.
What I didn’t fully appreciate at the time was that the market didn’t care what I thought it should do.
Most investors think “market timing” is a dirty word. I’ve heard ‘you can’t time the market’ a thousand times. The people that say that? Believe them—they can’t.
In the twelve years since I was fired from Carlyle, the Hedgeye team and I have built our entire risk management process around not screwing that up again. We don’t get every call right, but I’d humbly submit we’ve built a risk management framework that enables investors be more right than wrong.
Our “Risk Management A/B Test”
There are two core components of the Hedgeye risk management process. We call this process our “Risk Management A/B Test.”
A. Economic data: What is the current economic outlook (based on our fundamental research and Growth, Inflation, Policy (GIP) model)?
B. Market signal: What environment is the market pricing-in right now (based on our Trade-Trend-Tail/Risk Range model)?
Let’s break down those component parts.
The A) in our “Risk Management A/B Test” is our Growth, Inflation Policy (GIP) model.
At Hedgeye, we’re constantly measuring and mapping high-frequency economic data, feeding it into predictive tracking algorithms, and using that to make accurate forecasts about the current market environment.
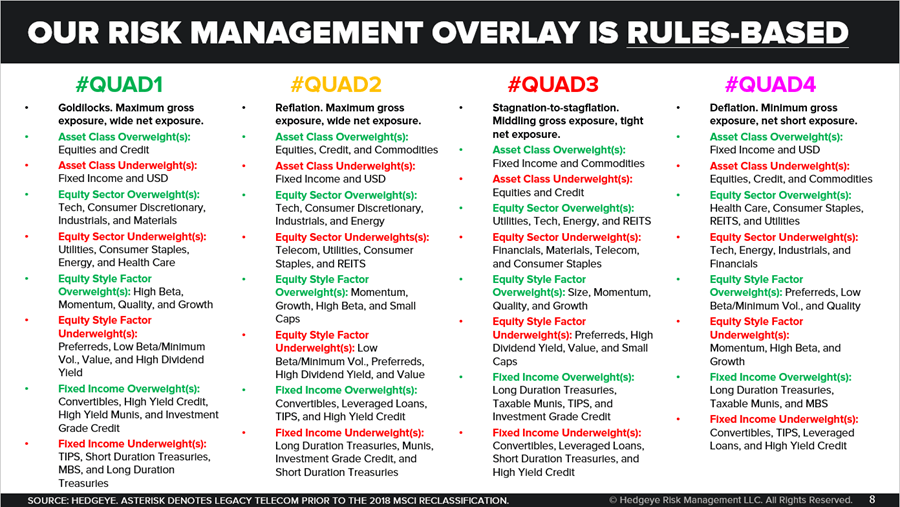
Our proprietary GIP model is designed to separate the economy into four distinct regimes (we call them “Quads”) which correspond to marginal rates of change of growth and inflation, which are two of the three principal components for predicting forward-looking asset returns. The third – monetary policy – is accounted for in our analysis by overlaying how central bankers are most likely to respond to implied changes in economic conditions.
From there, we get four possible outcomes. Each is assigned a “quadrant” in our Growth, Inflation, Policy (GIP) model and the typical government response as a result (neutral, hawkish, in-a-box or dovish):
- Growth accelerating, Inflation slowing (QUAD 1)
- Growth accelerating, Inflation accelerating (QUAD 2)
- Growth slowing, Inflation accelerating (QUAD 3)
- Growth slowing, Inflation slowing (QUAD 4)
If you look at the back-test, market history suggests the rate of change in growth and inflation are the most causal factors for forecasting future market returns (see chart below). That’s why if you can accurately predict growth and inflation, you’re able to understand the market environment you’re in and prepare yourself across asset classes, style factors and factor exposures. (We run the GIP process for the top 50 economies around the globe.)
(My colleague, Senior Macro analyst Darius Dale will have more to say about our GIP model in a subsequent email later this week.)

The B) in our “Risk Management A/B Test” is my Risk Range process.
The Risk Range process and my Trade-Trend-Tail model was developed while I was working as a portfolio manager at Magnetar Capital in the mid-2000s. You may recall that the Magnetar team came from Citadel in the mid-2000s. It pioneered many techniques now considered “best practices” by today’s hedge fund industry – particularly how to operate market neutral and manage factor exposure risk.
In my early days running a long-short portfolio at Magnetar, a risk management policy set by the firm would often neuter me out of positions. I developed my Risk Range process to try to stay ahead of and front run big changes that the risk systems started to spit out, things that would run counter to my positioning.
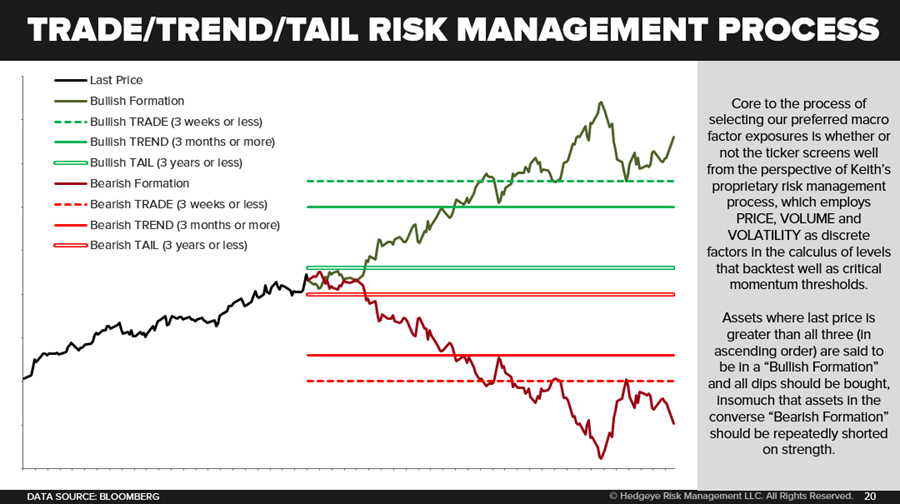
My quantitative Risk Range process uses price, volume and volatility at the index or ticker level to generate a probable range for that security over the short to intermediate-term. For example, if you’re looking at the S&P 500, the Risk Ranges suggest where you want to be buying (at the low end of the probable range) and selling (at the top end of the range).
Again, using the underlying price, volume and volatility of an asset, this proprietary signal also suggests critical thresholds, across different durations to help you identify Bullish and Bearish “phase transitions” – effectively helping you identify breakouts and breakdowns across specific assets.
I’d put our risk management process up against any buyside firms out there. In fact, if you aren’t measuring and mapping global economic data like we do, and interpreting it through the lens of our Risk Ranges, what are you doing to effectively manage Macro risk?
Which brings me to where I think we are today.
Let’s use our risk management A/B test framework to assess the current market outlook…
A. What is the market telling us based on our Risk Range model? #Quad4 in Q3 ✔
The S&P 500 has been dancing around its trend line and is now neutral trend. The Russell 2000 and Nasdaq remain bearish trend. Meanwhile, Treasury bonds remain bullish trend. Bond proxies like Utilities (XLU) are bullish trend and continue to make new all-time highs. The U.S. Dollar is bullish and just hit a new cycle high. Oil just failed to break out of its bearish trend.
This is exactly what you’d expect the market to be signaling in #Quad4.
B. What is the current economic outlook based on our fundamental research and Growth, Inflation, Policy (GIP) model? #Quad4 in Q3 ✔
The predictive tracking algorithms that feed into our GIP model suggest that the U.S. and global economy are headed toward #Quad4 in Q3 . With the advent of last week’s slowing PCE, Durable Goods, and Capex data, our nowcast for U.S. real GDP growth actually just hit a new low for Q3 of 2.11% year-over-year.
In other words, both our GIP model and Risk Ranges continue to signal #Quad4 in Q3 both domestically and globally.
I know what you’re thinking: The third quarter just ended, isn’t our #Quad4 in Q3 call over?
No.
Much of the #Quad4 data hasn’t been reported yet. Furthermore, we think Wall Street’s expectations for Q3 earnings (also still to be reported) are too high.
Wall Street expects Q3 earnings down -1.7%. We think earnings could be down -5% to -8%. Moreover, we see a broadening of in the coming quarter. Sectors like Energy, Materials, Consumer Staples and Tech have already reported two consecutive quarters of negative earnings. What if other sectors – like Consumer Discretionary – also enter an earnings recession?
History repeatedly suggests that when stocks are going up on bad news, you’ve got to sell into it. That’s the whole point about the recent blow-ups in FedEx, Oracle and Autodesk. We’re about to enter the thralls of #Quad4 economic data.
Be careful.

I’ll leave you with one final thing… #FullCycleInvesting
We call Wall Street the “Old Wall” because it is fundamentally broken. In the past 20 years, Wall Street and the complicit Old Wall financial media have plowed investors into stocks at every single cycle turn. Over that time period, you could’ve lost half your money twice blindly buying the CNBC-fueled pump and dump into stocks as the U.S. economy tipped into recession.
Don’t forget, you don’t even need a recession to lose a significant amount of money. During the last earnings recession in 2016, the average decline in the Russell 2000 was over -30%.
I founded Hedgeye in 2008 to teach investors a much better way to invest. We call our Macro process, #FullCycleInvesting. Diligently measuring and mapping economic data and helping you preserve and grow your capital throughout #TheCycle.
What I really don’t understand is how so many on Wall Street blindly cling to supposed “best practices” that so obviously don’t work. The chart chasers have their 50-day Moving Monkey. They always get chopped up during the big macro turns. Other people on the Old Wall start their day buying “cheap” stocks and shorting “expensive” ones. I can’t believe I have to remind investors that valuation is not a catalyst… the rates of change of growth and inflation are.
The Hedgeye process was built for market practitioners by market practitioners. Our mission since Day 1 has been clear—delivering hedge-fund quality research to everyday investors. Period, end of story.
Thank you for joining Wall Street 2.0. We truly appreciate your interest in our research process.
KM
Keith R. McCullough
Chief Executive Officer
