Below is a brief excerpt transcribed from today's edition of The Macro Show hosted by Macro Analyst Christian Drake.

These charts show the trends as we head further into the hardest comp of the U.S. economic cycle in 3Q.
With durables, we have...
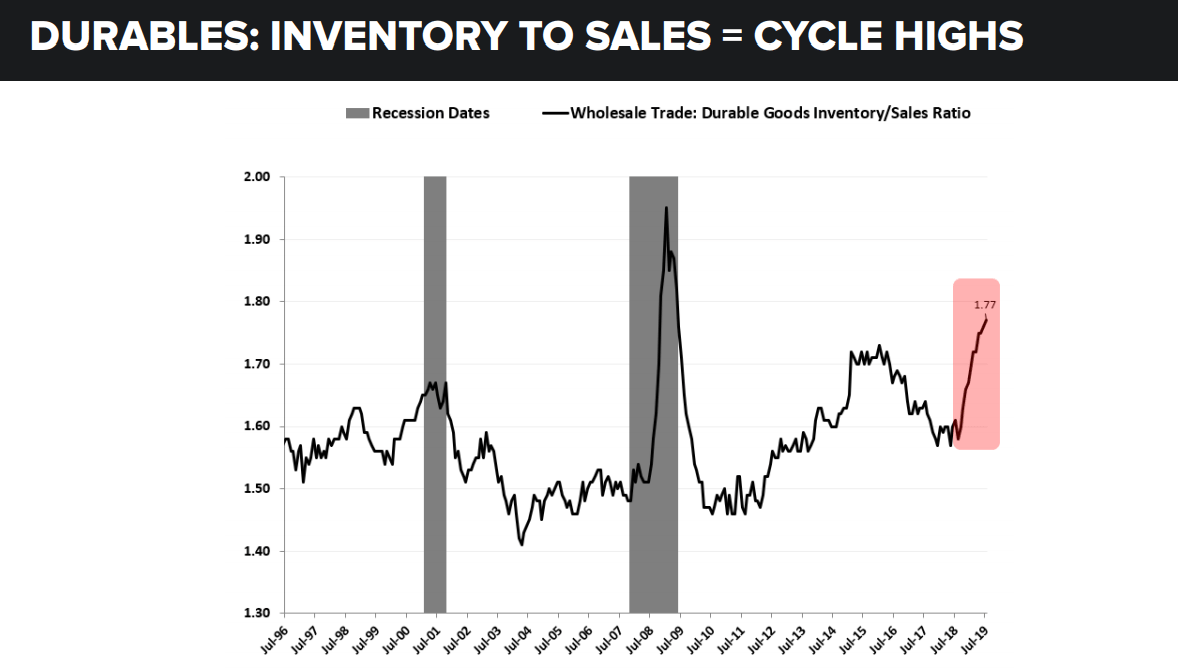
- Inventory to sales ratios are at cycle highs currently
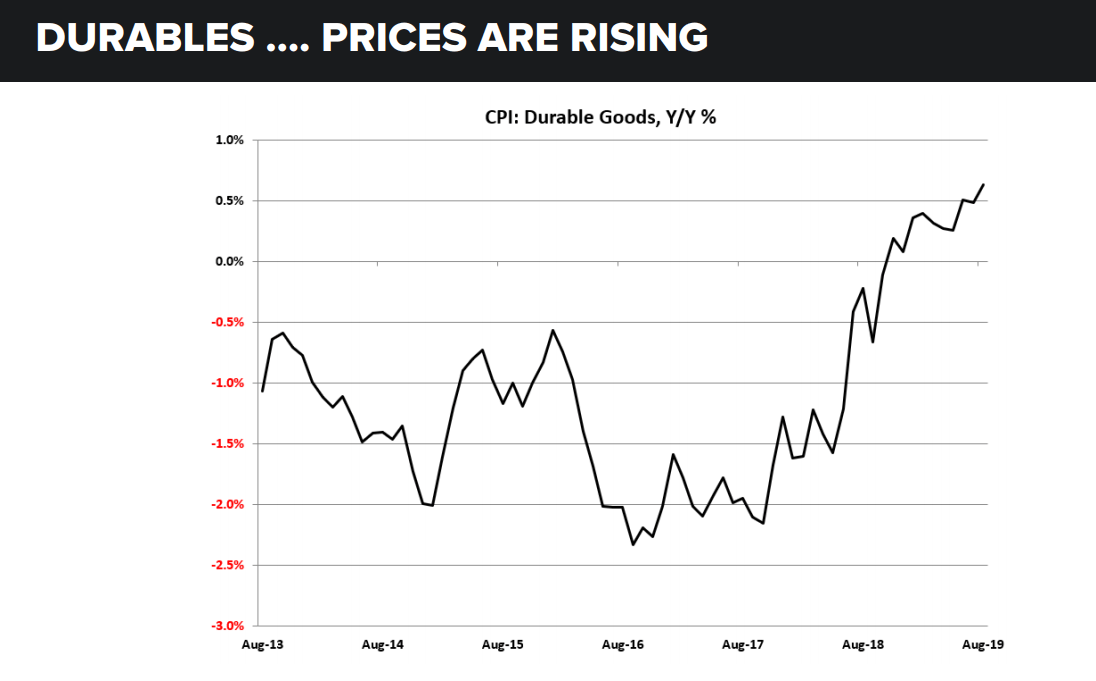
- Durable Good prices are accelerating and
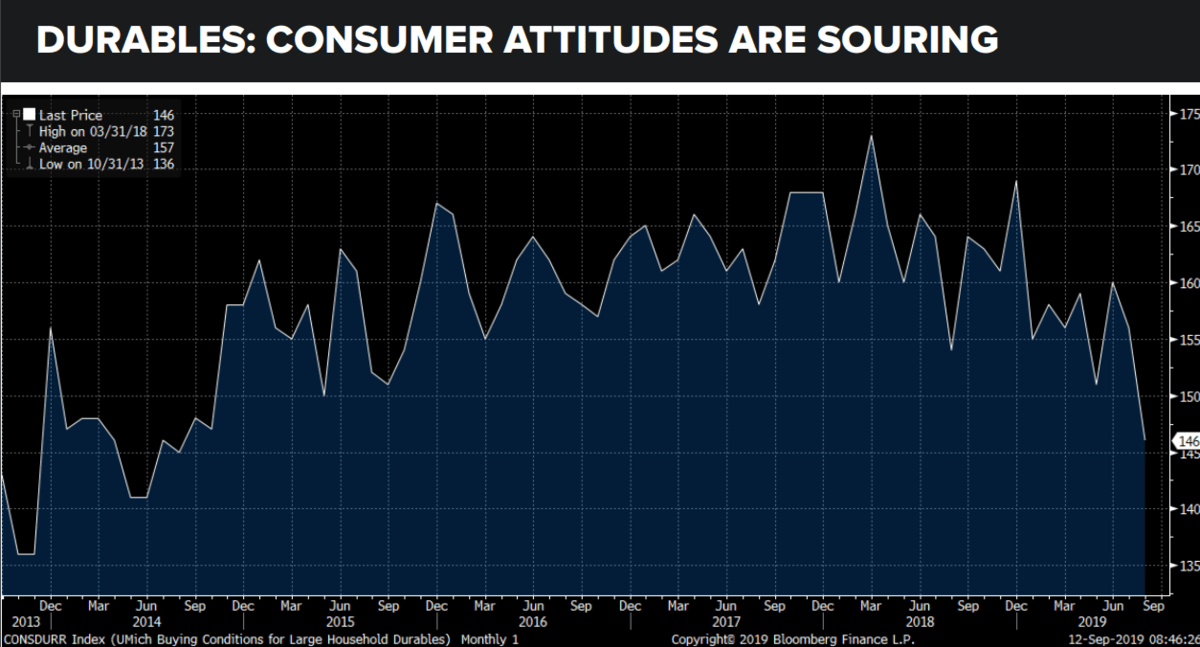
- Consumer attitudes towards Durable Goods are souring. This is from the University of Michigan survey asking consumers if they anticipate buying some high ticket consumer discretionary item in the form of durables. That's making new lows.
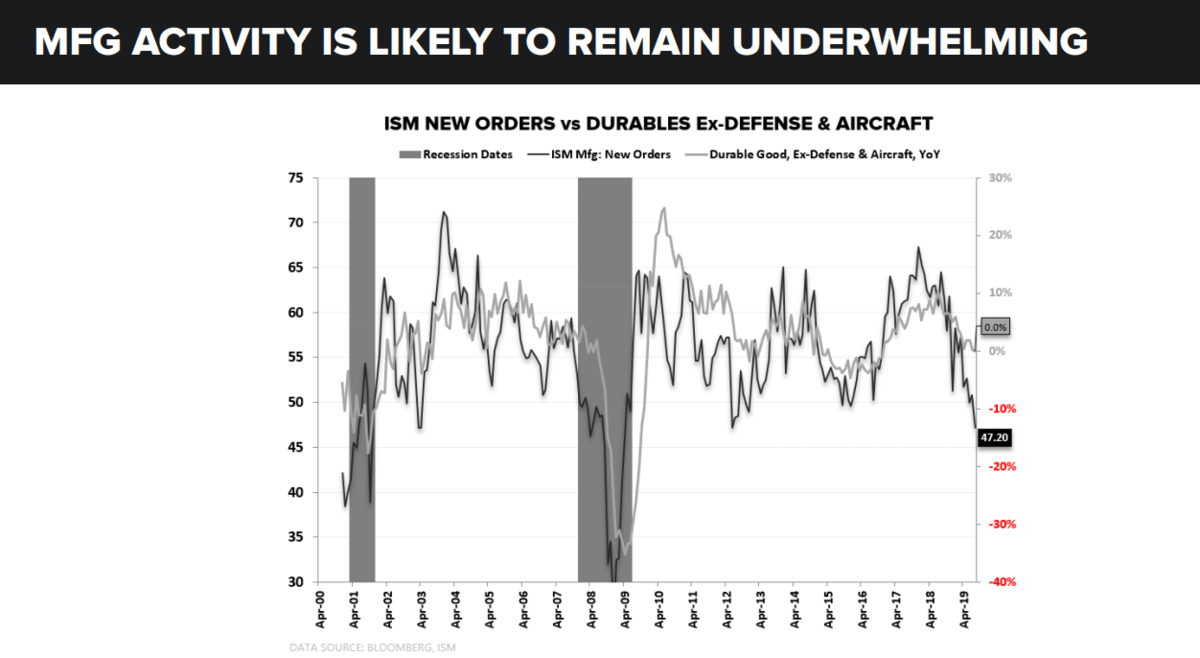
This directly impacts the New Orders component of Manufacturing. As you can clearly see, consumer demand is souring and new orders are falling.
You can see the relationship of New Orders to actual Durable Goods. We use Durable Goods ex-Defense and Aircraft as your proxy series that most closely aligns with what households would be ordering or purchasing. As you can see we have a great deal of catching down to do as the grey line (Durable Goods ex-Defense & Aircraft) catches the black line (ISM Manufacturing New Orders).
So domestic demand is slowing on the industrial and manufacturing side.
Meanwhile, export orders are also hitting new cycle lows. These are the lowest since the Recession.
And on this next chart we're showing export orders versus Corporate Profits from abroad. And corporate profits are heading lower as we head further into the hardest comp of the cycle in 3Q.