This past week initial jobless claims fell 11k to 448k from 459k (revised up 3k), which brought the rolling four-week average higher by 1.5k to 462k. As we said last week, there has emerged a clear divergence between the claims trajectory that dominated 2009 and the trajectory that has been in place year-to-date. The following charts demonstrate this. We remain concerned that without improvement in claims, a leading indicator, there can be no meaningful improvement in unemployment, a lagging indicator. By extension, without improvement in unemployment it will be difficult for credit costs to return to what are considered "normalized" levels. At a minimum, a return to those normalized levels will be delayed. Remember, for unemployment to fall meaningfully, initial claims need to fall to a sustained level of 375-400k. We remain 50-75k above that level - exactly where we've been for five months now.
As a reminder around the census, we've been bullish on the lift the census would add going into its peak employment months, but we're almost at the point now where it's time to start focusing on the drag it will create on the backside as the peak month of employment, May, is just 1 day away.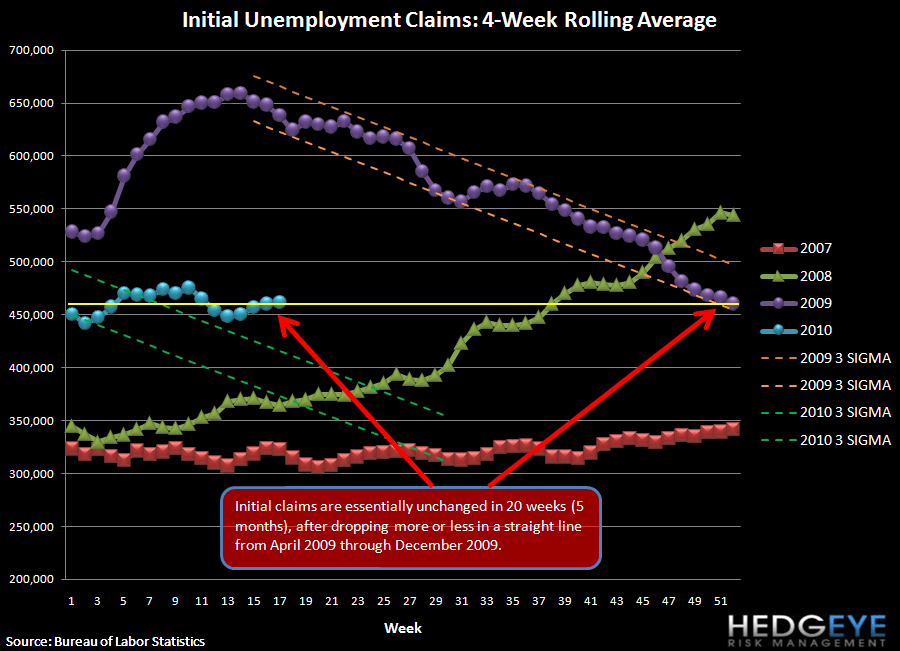
The following chart shows the raw claims data.

The following chart shows the census hiring timeline.

Joshua Steiner, CFA
Allison Kaptur
