“If you think you are too small to make a difference, try sleeping with a mosquito.”
-The Dalai Lama
New Month, Same Slope as the ‘next-verse-same-as-the-first’ macro mantra for Trending global Quad 4 conditions soldiers on.
Those pesky macro mosquito’s were swarming again last night as China PPI hit 0% Y/Y (this has flow through to U.S. PPI & the perpetuation of disinflationary pressure as we traverse peak CPI/PPI comps through July), Japan PPI printed -0.1% Y/Y, South Korean exports are signaling negative (& falling) domestic and global eps growth while New & Export Orders across global PMI’s and a cartoonish -38% Y/Y cratering in Japan Machine Tool Orders are signaling further deceleration in Industrial Activity in the reported June data.
Now, if you are one of the recalcitrant holdouts in the post-truth era who continues to frivolously anchor on …. I don’t know …. Data, you might have been inclined to view the sharp backslide in inflation expectations, the ongoing cratering in global PMI’s, ongoing negative revisions to EPS estimates, the longest ever stretch of negative global data surprises, and the general reddening across the domestic macro RoC heatmap as a signal that the balance of risk to Business Confidence and Capex appetite was to the downside to close 2Q.
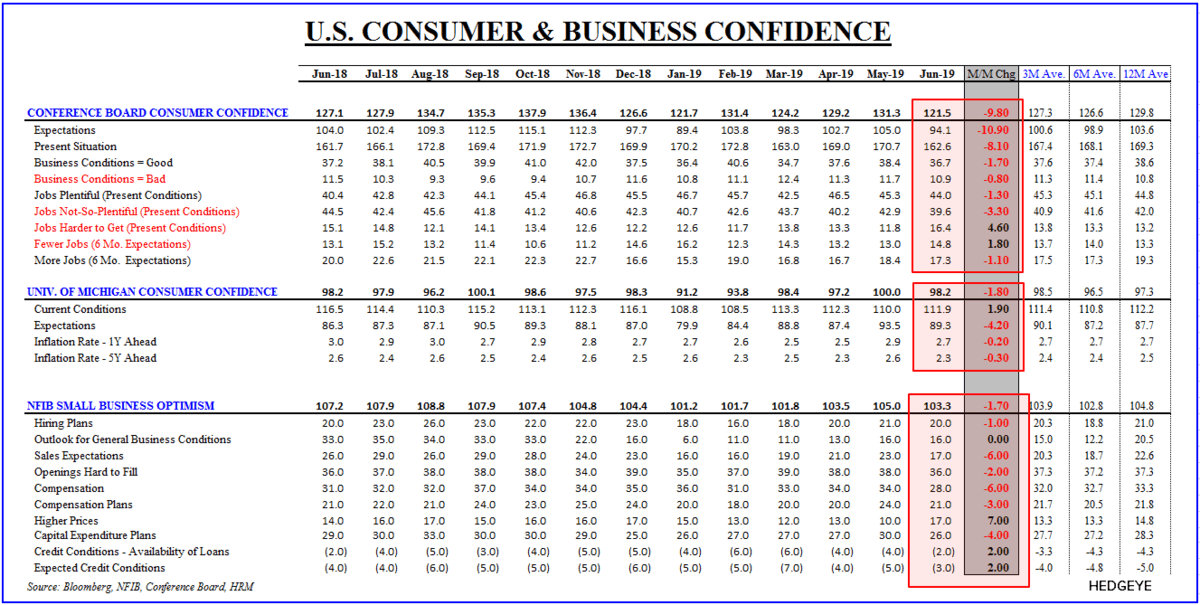
Well, the data came to honor your allegiance again yesterday as Domestic Small Business Sentiment followed Consumer Confidence lower in June with Sales Expectations and Capex Intentions leading the declines.
We’ve been over this recurrently the last 6-months, but it’s become increasingly conspicuous and probably worth repeating.
Trade policy certainly matters, but it remains primarily an amplifier to an underlying growth cycle which, in the present case, had already inflected negatively. Trump’s proclivity for negotiating in questionable faith and reneging on previously agreed upon terms imperils future negotiations as those party to potential agreements have no conviction that the negotiated terms will prove any version of fixed – a factor that only adds incendiary kindling to the uncertainty fire.
That same dynamic also pervades confidence and capex decisions.
If you have no conviction that current policy/laws/costs are going to prove durable and may, in fact, undergo multiple wholesale changes, why would you commit capital? … particularly when growth is slowing, comps are as hard as they get and margins are already under pressure.
In other words, while equities may take some solace in soft “Trade Truces” and “Policy Pivots,” it’s not clear that the cratering in investment, industrial activity and forward expectations on the part of consumers, small businesses and CEOs can manage a durable inflection, at least until a more tangible medium-term catalyst emerges and/or base effects support an organic turn in the cycle.
With demand slowing, inventories elevated, resi and non-resi private investment already slowing and capex expectations falling, this is already what is manifesting in the data.

Despair not, though, ye passionate RoC proselytes, strident purveyors of inconvenient (data) truths and certified practitioners of slope-centric analytics. The Quad framework remains the Chuck Norris of conceptual frameworks and your favorite strategists’ favorite strategy.
With Utes (XLU) and REITs (VNQ) leading sector performance again yesterday (and leading sector style performance since we made the growth inflecting call in 4Q18), the full cycle investing truth will continue to set you free.
Back to the Global Macro Grind ….
So, apparently it’s still all about the Fed as we remain in a holding pattern of policy and geopolitical surreality ahead of Powell’s testimony today/tomorrow.
If you’ve been paying attention to the more technical aspects of policy implementation, you’ve seen that the Fed Funds Rate has traded at a growing premium to the IOER rate, a dynamic that has developed as QT has progressed and excess reserves have fallen to test the point at which they are no longer, practically “excess”.
We’ve discussed this previously, but I wanted to take a little bit of a didactic digression this morning and re-review the mechanics of Fed policy because, despite being pretty well covered, it still seems poorly understood.
There’s endless nuance to be had around this discussion. And while I’m no banking sector or market structure analyst, here’s the layman summary:
- The Traditional Fed Funds Market: The Fed sets the policy rate via intervention in the Fed Funds market (where banks lend to each other overnight). Traditionally, activity in the Fed Funds market was dominated by domestic banks with smaller participation from the federal home loan banks and other smaller participants (who they are isn’t particularly important here).
- Post-Crisis: Banks accumulated trillions in excess reserves and didn’t need to borrow in the Fed Funds market, leaving the home loan banks as the primary participants.
- Interest Rates on Excess Reserves (IOER): In the post-crisis period, banks could park excess reserves at the Fed and earn the IOER. Until June of last year the IOER was the same as the top of the policy target rate. The federal home loan banks could not park funds at the Fed and earn the IOER, so they were left participating/looking for yield in the Fed Funds market.
- The Arb| Borrow at Fed Funds, Lend at IOER: What’s been happening post-crisis is that banks borrow from the remaining participants in the Fed Funds market (those who are ineligible to park excess cash at the Fed at the IOER rate). They lend to banks at a rate below the IOER and the banks then arbitrage the difference and earn the spread between the market Fed Funds rate and the IOER.
- Reverse Repo Rate (RRP): “Reverse Repo” sounds very sophisticated but all it refers to is the rate at which the Fed borrows money overnight. On other words, Company X gives the Fed dollars overnight in exchange for a bond from the Fed, and the Fed pays them interest on it. The interest rate the Fed pays is the reverse repo rate.
- RRP – Fed Funds – IOER: The Fed sets the reverse repo rate and it represents the floor in rates, the IOER represents the ceiling and the effective Federal Funds Rate should fall in between.
So, in this setup, non-bank participants can either lend at the RRP rate to the Fed or lend to banks at something above that RRP rate but below the IOER (which they are ineligible to receive).
When the Fed wants to move rates up or down, this interest rate corridor or floor-ceiling setup is maintained but simply stair-stepped higher/lower depending on the policy path.
Maybe read all that again.
If you understand those mechanics, it’s easier to understand why the Fed Funds Rate shouldn’t typically trade above the IOER rate and, if it is, it’s signaling that the current level of excess reserves and/or the size of the Fed balance sheet may be reaching critical thresholds.
For our purposes, there are a couple top-down implications:
- When “excess reserves” just become “reserves” and ongoing QT starts to manifest, empirically, in liquidity tightness, then the capacity for higher volatility in ST rates markets increases, the capacity for the Fed to control the policy rate diminishes as does its credibility.
- QT and debt/deficit spending have been twin drags on dollar liquidity (I give you bonds, you give me dollars) and supportive of dollar strength. The cessation of QT would remove one of those supports and would sit as a factor underlying the progression in our expectation for a peak in the $USD.
If you’ve gone from blank canvas to full understanding of rate setting mechanics – or even if you’re just still awake - congratulations. Enlightenment remains a tedious exercise in baby-stepping.
Our immediate-term Global Macro Risk Ranges (with intermediate-term TREND signals in brackets) are now:
UST 10yr Yield 1.94-2.09% (bearish)
SPX 2 (bullish)
RUT 1 (bearish)
NASDAQ 7 (bullish)
Utilities (XLU) 58.88-61.46 (bullish)
REITS (VNQ) 85.56-91.45 (bullish)
Financials (XLF) 26.89-28.57 (bearish)
VIX 12.07-17.59 (neutral)
USD 95.05-97.30 (neutral)
Oil (WTI) 55.50-60.11 (bearish)
Nat Gas 2.17-2.47 (bearish)
Gold 1 (bullish)
Copper 2.64-2.74 (bearish)
Best of luck out there today,
Christian B. Drake
Macro Analyst