
THE HEDGEYE EDGE
Following Marriott International's (MAR) weak first quarter, we still see a disconnect between sentiment and valuation vs industry and company specific catalysts. RevPAR matters folks, even as the bulls point to the much lower impact to EBITDA from RevPAR changes. Historically, valuation multiples compress dramatically following negative RevPAR pivots and we expect lower RevPAR forecasts and multiple contraction for MAR.
Looking past just 2019 unit growth, MAR’s pipeline is showing some cracks in its foundation – a potentially big blow to the bull thesis. The bear case could already be accelerating as MAR will be under a microscope to deliver EBITDA beats and incrementally more positive forward looking commentary with regards to the pipeline and RevPAR outlook. We see longer term top line and EBITDA growth as likely to disappoint with more negative evidence to emerge over the next several quarters. Our call is less about near term EPS, but more about multiple contraction as growth decelerates.
KEY issues | growth drivers under pressure
RevPAR growth slowing, and still losing share (adjusted for geography quirks)
As we expected, Q1 RevPAR finished at the very low end of MAR’s 1-3% guide and also below Street expectations of ~2%. MAR outperformed in international markets, particularly the AsiaPac region, but underperformed our Street low expectations in its most critical RevPAR market, North America. This underperformance continues to be driven by slower growth out of its Limited Service brands, which again lost out to its main competitor in HLT and the STR industry metrics. For reference, MAR’s 1.1% RevPAR growth in Q1 was the slowest RevPAR growth since Q4 2016.
Our featured chart for the key topic of RevPAR is one we first shared in our MAR deck but is now updated with Q1 data. We crafted up our own RevPAR “indices” for HLT, H, and MAR and looked at the spread between HLT and H brands vs. MAR’s – for Limited Service only. Our RevPAR index does not factor in geography which could be impactful, but given the longer duration, these impacts should smooth out. Implications of losing Index share could negatively impact out-year unit growth and/or conversion opportunities.

Pipeline slowing = out-year unit growth slowing
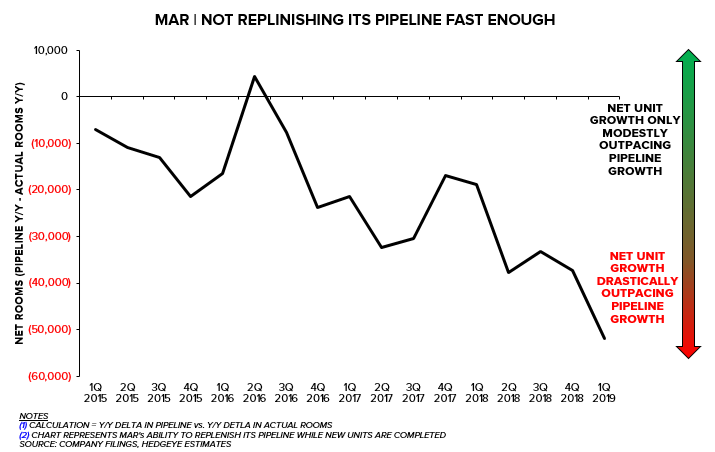
A key risk for the industry, and particularly MAR, is the risk that out-year unit growth will disappoint company and Street expectations. MAR’s Q1 pipeline number posted its first sequential decline in the last 5 years, and when gauged relative to its base (the proper way to measure pipeline) the pipeline slowed to its lowest point since Q1 2017. While in absolute terms MAR’s pipeline is the largest in the sector, and should allow for a solid pace of gross room additions, the current slow down does not provide much wiggle room to account for deletions, construction delays, etc. Another way to analyze the pipeline is to look at the raw number of (net) units MAR is adding to its pipeline vs the number of units its adding to its actual room base, which we detail in the second chart below.
Historically, given MAR’s size rarely will the pipeline expand more than actual room deliveries, but there should be somewhat of a balance as we generally saw prior to 2018 and Q1 2019. As the chart shows, Q1 2019 marks the biggest spread between net room deliveries and pipeline expansion – a clear indication that it’s becoming more difficult for MAR to maintain high unit growth targets and simultaneously replenish their pipeline.

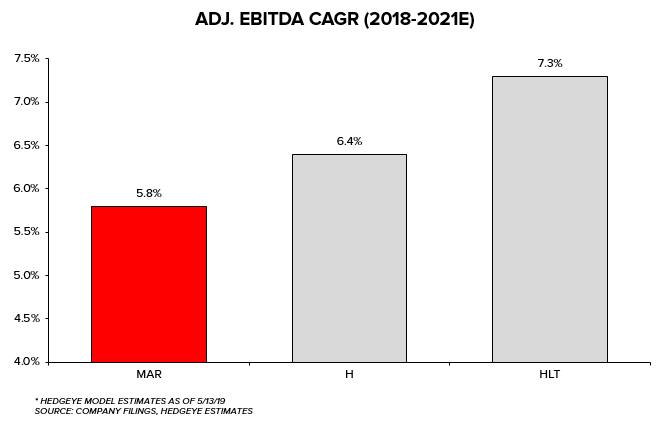
EBITDA CAGR likely slower than peer set and below Street
Owing to slower unit growth and underperforming RevPAR growth, our model suggests MAR is likely to grow its bottom line at a slower pace for the out-years. Sure, given the sheer size and lack of any real financial leverage, MAR will be able to buy back plenty of stock, but we do believe the capital return premium MAR should receive will be offset by its inability to grow as fast as its competitors. With a high rate of capital return already expected by investors, core growth will become more of needle mover on valuation, in our view.
ONE-YEAR TRAILING CHART

