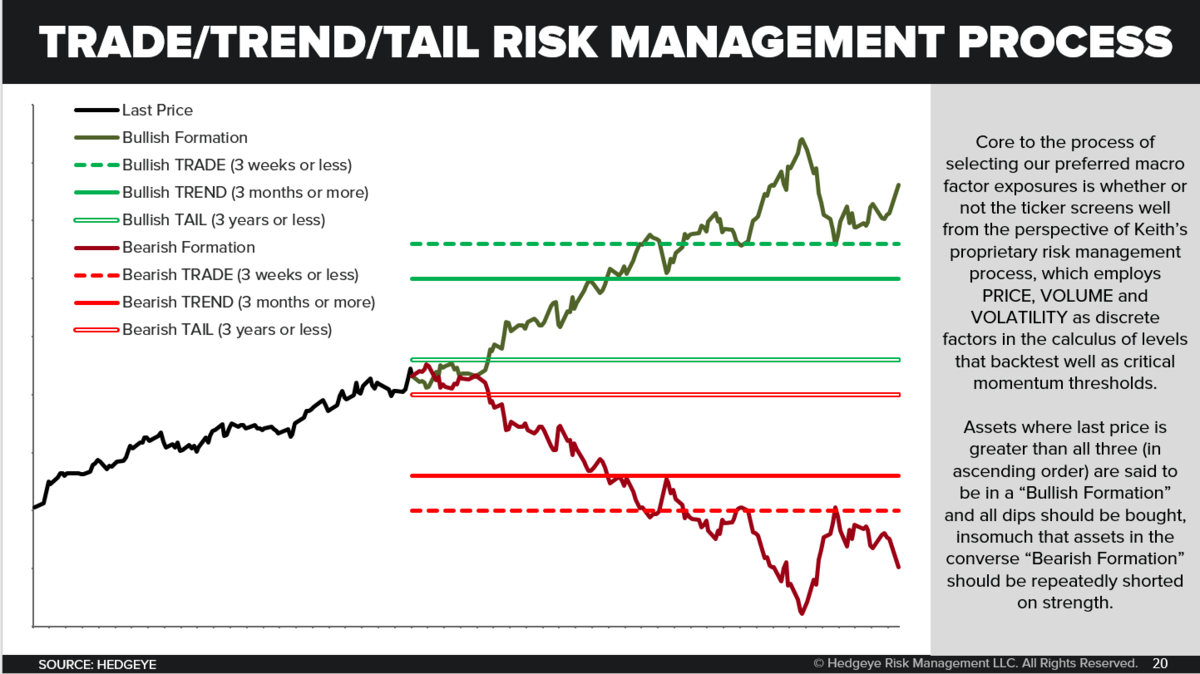
Editor's Note: Below is a brief excerpt and chart from today's Early Look written by Hedgeye CEO Keith McCullough. Click here to learn more about the Early Look.
|
Over time, I just make better decisions than a clueless version of a market Mucker would have 15-20 years ago. Rather than making emotional decisions (selling low and covering high) I’m constantly using the #process to fade those feelings. “Over time” means over the course of The Cycles that, God willing, I’m alive to risk manage in full (yes, they take time, and long-term investors get crushed if they disrespect them at the turns). “So”… while it’s fun to send you short-term signals and be held accountable to each and every one of them (I challenge you all to try it in the fishbowl like I do!), the short-term Risk Range is really what I use to get the longer-term right. Is the daily Risk Range always right? Obviously not. Also, don’t forget that with every second, minute, hour, etc. of market PRICE/VOLUME/VOLATILITY changing, the Risk Range changes. What I publish daily is a static range based on the prior day’s closing prices. |