“Dilly, Dilly”
So, for the last 6 months Bud Light has entertained us with an aggressive agitprop campaign vilifying Coors and Miller for using Corn Syrup in their beer production process.
Here’s the thing: It’s pure, unadulterated delusion designed to piggyback on the public’s (negative) perception of high fructose corn syrup – the nefarious caloric conspirator responsible for the progressive paunch-ing of America.
I don’t want to delve too far into the contrived devilry but:
- The yeast used to make beer needs a sugar substrate on which to feed and that sugar is ultimately processed into ethanol. It doesn’t matter what sugar is used, none of it ends up in the final product.
- Corn syrup and High fructose corn syrup are not the same thing. For practical purposes, Corn syrup isn’t really much different than regular refined, white sugar.
- Again, it doesn’t matter because the sugar is fully metabolized by the yeast into ethanol and is not part of the final product anyway.
- Anheuser-Busch makes corn syrup in the production of pretty much every other beer they make besides Bud Light.
- See points #1 and #3 again

Corn’s ascendency is a unique story of industrial happenstance (& whiskey production) that was cemented and propagated by domestic policy (farm subsidies). In short, corn is cheap and cheap is good (cheap corn = cheap food (for humans) = cheap feed for cattle = cheaper beef prices, etc).
And when cheap is subsidized, supply goes up and manufacturers are incentivized to find increasingly creative ways to include cheap in their products (think every snack, chip, cereal, processed grain product). Let that incentive structure cycle and self-optimize for a few decades and you have yourself a full serving of corn ubiquity and an exceedingly convenient way for American’s to consume an extra 500 hollow calories a day.
The story of Soy’s domestic, agri-ascendency is similar, albeit more recent and defined by the pervasive adoption of genetically modified crops. It also (conditionally) raises estrogen levels in men and may be partially responsible for >50% decline in average sperm count levels in men, globally, over the last half century …… another discussion, another time.
Back to the Global Macro Grind ……
Seen a 3Y chart of Soy lately? That, for all my physique phile’s who know that summer abs are made in the winter, is a chart on a diet!
For the past 2 years, Soybean prices have served as a kind of price proxy for the state of U.S.-China trade negotiations. It bounced to another lower-high yesterday after making a fresh 125-month low on Monday.
Tariffs are, of course, macro tourist central but for a domestic and global economy currently walking the 2nd derivative edge of acceleration/deceleration, it matters, so let’s connect the latest high frequency macro dots and contextualize the cross-asset implications:
Importing Global Quad 4 ….
Yesterday’s import price data serve as a convenient microcosm for the state of (global) price dynamics and the interplay between growth, inflation, policy and Fx.
Import price growth decelerated -70bps to -1.0% Y/Y in April, marking the slowest pace of price growth since July 2016 – a dynamic which underscored Keith’s central message in yesterday’s Early Look as investors attempt to discount walking the knife’s edge of Quad 3 and Quad 4 while wrestling with the net impact of Trade Policy as we look out to 3Q19. As it stands, the flow through impacts of Global Quad 4 (synchronized global slowdown) and the associated strong $USD continue to manifest in imported disinflation, constraining a more conspicuous breakout in domestic inflation despite the policy pivot out of the Fed.
0 for 3 ….
China’s March macro data - which featured marked improvement in Industrial Production, PMI’s, Export Growth, Credit Growth, etc - helped buttress global equities and propel the reflation narrative alongside incrementally dovish global central bank messaging. The early April data, however, suggested that ‘stabilization’ remained decidedly tenuous as export growth reversed course, the trade surplus deteriorated, and credit growth slowed.
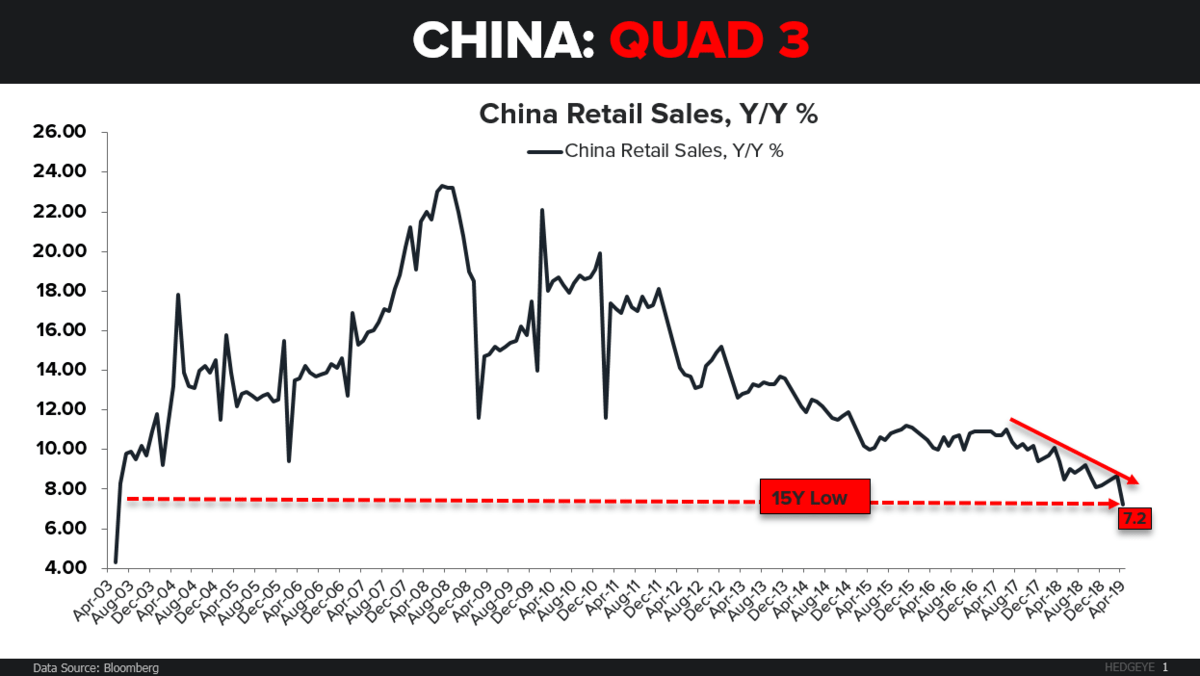
That brought us to last night where China went 0 for 3 as Retail Sales growth, Industrial Output growth and Fixed Asset Investment all decelerated while missing estimates across the board.
Chinese Bud Light?
The reasons for celebrating the March macro data are the same as those cultivating the angst here alongside the reported April figures.
If the March bounce was, in fact, a product of seasonal distortion and delusion and the immediate-term Trend remains one of deceleration, then the (global) reflation narrative – of which China is a central character – is at increasing risk of being derailed.
Moreover, falling Chinese industrial activity and import demand threatens the fledgling 2nd derivative stabilization in the Eurozone Industrial/Export economy, augurs further weakness for an Australian economy already under duress and continued pressure on EM economies levered to global trade/activity and the Chinese demand curve. Further slowing in China would also compound, instead of cushion, any downside stemming for a deceleration domestically.
Inclusive of last night’s data, the nowcast for the Chinese economy has moved into Quad 3 for 2Q19E, confirming the market signal (the A part of our A/B test) which saw the Shanghai Composite move to neutral Trend on 5/6 then Bearish TREND on 5/8.
While further synchronized slowdown probably ultimately results in incremental central bank dovishness and/or outright easing/stimulus … there’s a lot of risk to manage to between here and there.
What a Tool! …..
If you were looking for a bastion of fundamental strength across the balance of Asia to buoy sentiment, Japan and Indonesia regret to inform you of their own April atrophy. Machine Tool Orders in Japan dropped a cartoonish -33.4% Y/Y while Indonesia Exports growth cratered -13.1% Y/Y.
$USD: To tie this all together …..
Slowing Chinese growth (and downward pressure on the Yuan) and a further perpetuation of global Quad 4 conditions will further support the $USD. Ongoing U.S. dollar stability-to-strength will remain a constraint on domestic inflation while further tightening financial conditions for DM/EM economies already suffering from tight dollar liquidity amidst QT (I give you bonds , you give me dollars), higher deficit spending (higher deficits = more bond issuance = I give you bonds, you give me dollars) and more protectionist policy/lower global trade (less global $ supply)
On the trade front, tariffs are unequivocally inflationary with respect to consumer prices, in isolation. However, those incendiary forces are counterbalanced by a stronger dollar and the disinflationary impulses that accompanies slower growth – a dynamic evident in the import price data above.
It’s the net effect – and which side of the Quad 3/Quad 4 line that we end up falling on - that the market is struggling to discount.
Confidently Uncertain and Schizophrenic ….
Consider Yesterdays NFIB Small Business Confidence data where global developments and rising uncertainty complicate strict adherence to data-dependence.
Small Business Confidence rose +1.7pts, marking a 3rd month of improvement and a new YTD as ongoing labor market strength and new equity ATH’s continued to buoy sentiment. Pretty good, eh? …. but that simply marks another lower high and doesn’t capture the latest financial market volatility cluster … and do you think anyone will care about an April NFIB figure if June/July PMI’s/ISM’s are printing sub-50 as uncertainty re-crescendo’s and global activity/trade volumes shudder should the trade war escalation propagate further.
Monday was a Quad 4 day, Tuesday was a non-Quad 4 day again. Wednesday’s futures look like they can’t make up their mind …. although the miss and deceleration in April Retail Sales may tip the balance.
Next Verse, Same As the First ….
So, we are walking the knifes edge between Quad 3 and Quad 4 domestically and between Quad 1 and Quad 4 globally. The difference between acceleration and deceleration is within the margin of error of our model so we could reasonably fall either way. That obvious makes the investing environment more challenging, but we’ll manage that risk the same way we’ve been risk managing the choppy phase transition in growth for the last 8-monhts.
We’ll continue to allocate to exposures that work in both Quad 3 and Quad 4 (bonds, for example) while tactically adding our analysts favorite exposures at the low end of the range and selling/shorting at the high end of the range.
Keep taking risk managed, high probability swings at pitches over the (growth-slowing) plate. Different prices, same process.
Our immediate-term Global Macro Risk Ranges (with intermediate-term TREND signals in brackets) are now:
UST 10yr Yield 2.36-2.50% (bearish)
UST 2yr Yield 2.14-2.30% (bearish)
SPX 2 (neutral)
RUT 1 (bearish)
NASDAQ 7 (bullish)
Utilities (XLU) 56.72-59.01 (bullish)
REITS (VNQ) 85.24-88.12 (bullish)
Energy (XLE) 62.64-65.34 (bullish)
Financials (XLF) 26.20-27.43 (bearish)
Shanghai Comp 2 (bearish)
Nikkei 205 (bearish)
DAX 110 (bullish)
VIX 14.42-22.23 (bullish)
USD 96.60-97.81 (bullish)
EUR/USD 1.11-1.13 (bearish)
USD/YEN 108.69-110.90 (bearish)
GBP/USD 1.28-1.30 (bearish)
USD/CHF 1.00-1.02 (bullish)
Oil (WTI) 60.12-63.93 (bullish)
Nat Gas 2.50-2.69 (bearish)
Gold 1 (bullish)
Copper 2.70-2.84 (bearish)
AAPL 182.51-200.30 (neutral)
AMZN 1 (bullish)
FB 179-198 (bullish)
GOOGL 1113-1193 (bearish)
NFLX 337-366 (bearish)
TSLA 220-252 (bearish)
Bitcoin 5 (bullish)
Best of luck out there today,
Christian B. Drake
Macro Analyst