The guest commentary below was written by Christopher Whalen.

“Stock prices have reached what looks like a permanently high plateau.” -Irving Fisher, Autumn 1929
Is the free ride over for financials? For the past decade, banks and other leveraged players have basked in the warm embrace of artificially low interest rates and not quite so low yields on various asset classes. The just completed cycle of Q1 2019 earnings for public companies suggest that the outlook for financials may be a good bit less accommodating than the recent past.
One trend we note in the latest earnings cycle was the number of US banks that were explicitly guiding down investor expectations with respect to future net interest margin or NIM. The state of confusion with respect to interest rates and yields seems to have thrown a spanner into the proverbial gearbox of Wall Street hyperbole. Our survey of bank earnings suggests that the year-over-year change in funding costs in Q1 may exceed the 70% rate of change in Q4 2018.
Just about everywhere you look, one chart seems to describe whatever asset class is under examination. A typical example is the chart below which shows the S&P 500 (SPX) over the past year.
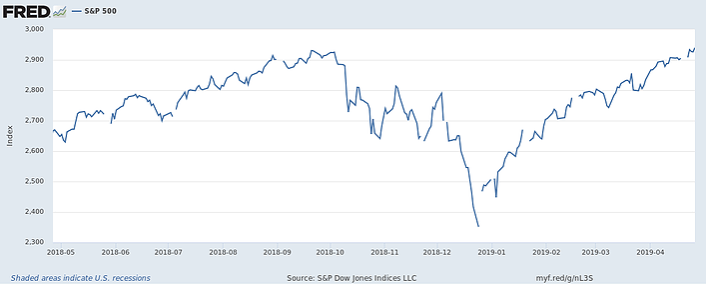
Notice the yawning crevasse where we all stood in late December of 2018, when securities issuance in the United States nearly stopped. Looking at U.S. Bancorp (USB), for instance, which we own and is among the better performers among the largest banks, the market value of the common equity has not quite returned to the levels seen around Halloween. With most financials, we’ve basically waltzed sideways over the past 12 months, albeit with lots of volatility to amuse everyone. Looking at large cap financials as a group, we’re basically back to where we stood in October of last year.
The December massacre engineered by Chairman Jay Powell and his colleagues on the Federal Open Market Committee left an impression on just about every asset class we surveil. Could it be that our colleagues among the ranks of bank analysts have finally figured out that the wind has shifted when it comes to NIM for banks and non-banks alike? Looking at the world of leveraged loans, for example, the volumes have not returned to this once toni neighborhood in the world of junk credit.
Joe Rennison writes in The Financial Times that the “rout” in leveraged loans continues, driven in part by falling interest rates of all things. He notes that total outflows from the sector reached $26 billion since November, when the wheels began to seriously fall of the cart in the world of credit. “The long stretch of outflows has dented the assets of some of the biggest loan fund managers,” notes Rennison, but adds optimistically that “loan prices have recovered from a sell-off in the fourth quarter of 2018.”
One of the great things about watching monetary economists try to “fine tune” monetary policy, an idiocy we today refer to as macroprudential policy, is that it creates great trading opportunities for those with strong constitutions and the ability rationalize the nonsensical. Thus we lightened up on mortgage exposures in December, believing the proverbial credit bottom in that asset class is nigh, but loaded up on USB common and preferred, and even some Citigroup (C) preferred as well.
Of course the precursor to the December massacre was seen in August of 2018, when credit spreads began to move. By October, high yield spreads set a trough of sorts around 325 bp over the curve and started to move higher, peaking just shy of 550 bp over on January 3, 2019. As Feldkamp’s first rule states, when bond credit spreads widen, wealth is destroyed and economic growth suffers accordingly. The chart below shows high yield and investment grade spreads.
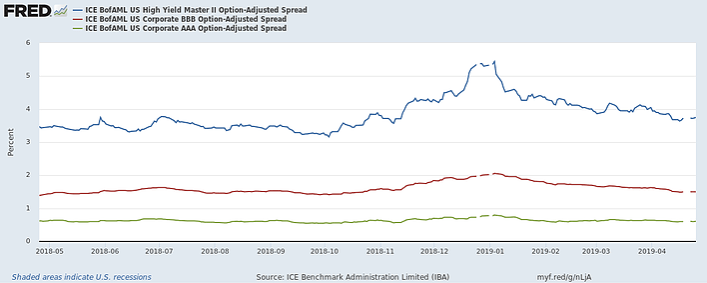
Spreads have come back strongly since January, one reason why stock prices have recovered and even hit new highs. If you want to pick two indicators to watch as a general guide to market moves, credit spreads and the SPX are probably the two best broad indicators around. As we noted in Financial Stability (2014): “Understanding what moves credit spreads allows us to construct and test policies that allow the United States to create and sustain financial stability.”
What concerns us about the present day is the widely held assumption that the artificial increase in asset prices engineered by the FOMC since 2010 is permanent, a view we ourselves have advanced with respect to residential real estate. But maybe not. Could it be that bank credit costs are set to rise after years of artificially low levels of loss?
Economists of a century ago were perhaps too involved in the euphoria of the markets, as in 1929 when Irving Fisher uttered his now infamous phrase about stock prices. Yet today’s economists are entirely divorced from the markets, surrounded by the conflicts cordon that encases all government officials in a sterile void not unlike outer space.
Financial breaks like 1907 or 1929 or 2008 are long in the making, however, and usually start from the periphery of the financial markets are work towards the center. The Great Crashes of 1929 and 2008 both were preceded by a decade of boom and bust in sectors of the real economy far from lower Manhattan.
Thus when we see growing deceleration in once red hot real estate markets around the country, we do start to wonder. Images of the great Florida real estate boom of the mid-1902s come to mind. As John Kenneth Galbraith wrote in “A Short History of Financial Euphoria,” the boom of the mid-1920s started in the Sunshine State:
|
“And present also was leverage; lots could be purchased for a cash payment of around 10 percent. Each wave of purchases then justified itself and stimulated the next. As the speculation got fully under way in 1924 and 1925, prices could be expected to double in a matter of weeks. Who need worry about a debt that would so quickly be extinguished?” |
Kinda sounds like the leveraged loan market, does it not? As we’ve noted over the past many months, credit risk in bank 1-4 portfolios have been negative for several quarters now. Yet if the prices of more expensive residences are now under pressure, can higher bank credit costs be far behind?
The chart below is from Weiss Analytics (Note: Whalen Global Advisors LLC is a shareholder in WA) shows the percentage of houses falling in value in various markets around the US. Suffice to say that high end home prices are decelerating in some of the most desirable areas. The WA home price index includes more than 80 million residential homes.

Keep in mind that in many of the hottest markets around the US, there were virtually no homes falling in price three years ago. The picture has changed rather significantly over the past 18 months. If the falling home price trend described in the chart above is confirmed, then we would expect to see increased pressure on net default rates across the mortgage sector.
As we’ve noted before, low interest rates and tight spreads have the benefit of concealing credit risk for a time, but eventually the proverbial trend line reverts to the mean. Loss given default for bank owned 1-4 family mortgages is currently negative, but the 40-year average loss is over 60% of the loan balance. If home prices fall significantly, defaults will rise – and this will occur just as bank funding costs will have fully normalized.
For these and several other reasons, the free ride in financials c/o the FOMC may truly be over. As Galbraith wrote: "Financial genius is before the fall."
EDITOR'S NOTE
Christopher Whalen is Chairman of Whalen Global Advisors LLC. He has worked in politics, at the Federal Reserve Bank of New York and as an investment banker for more than 30 years. He is the author of three books Inflated (2010), Financial Stability (2014) and Ford Men (2017).
In 2017, he resumed publication of The Institutional Risk Analyst and contributes to many other publications and media outlets. He recently launched the first volume of The IRA Bank Book, a review of the operating and credit performance of the US banking industry written for institutional investors.