“This irrational circular information-processing pattern is called motivated reasoning.”
-Annie Duke
That’s an important #behavioral reality to consider when you’re thinking about market expectations. Annie Duke did a nice job in a section of Thinking In Bets that she called The Stubbornness of Beliefs that explains motivated reasoning:
“Flaws in forming and updating beliefs have the potential to snowball. Once a belief is lodged, it becomes difficult to dislodge. It takes on a life of its own, leading us to notice and seek out evidence confirming our belief and ignore or work hard to actively discredit information contradicting the belief.” (pg 59)
It’s also called confirmation bias. And I think the best way to avoid it is by being vigilantly data-dependent in updating your beliefs with real-time (daily) information. Unless you’re a perma bull (or bear) marketing your product/service, that is…
Back to the Global Macro Grind…
If you think it’s fake news that the SP500 and NASDAQ closed at all-time highs yesterday because “earnings were better than expected”, it’s not. They’ve not only been better than expected, they’re not in an Earnings Recession, yet…
In order to avoid any confirmation bias with our call that the probability is rising that year-over-year US Earnings can be down -5-8% by Q2 and Q3 of 2019, we nowcast that view with every single earnings report, daily.
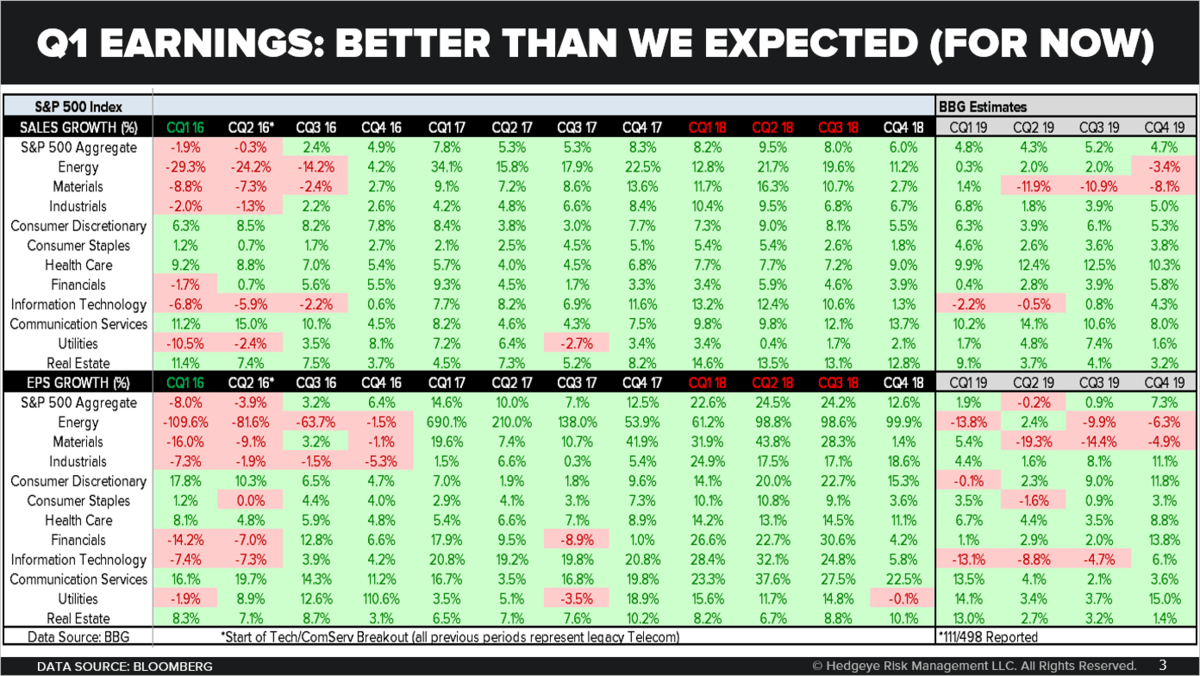
As you can see in today’s Chart of The Day (#process slide 60 in our Q2 Macro Themes deck):
- 111 of the SP500’s companies have reported Q119 year-over-year EPS growth of +1.86%
- 32 of 67 Financials companies have reported Q119 year-over-year EPS growth of +1.1%
- 3 of 29 Energy companies have reported Q119 year-over-year EPS growth of -13.8%
- 20 of 70 Industrial companies have reported Q119 year-over-year EPS growth of +4.4%
- 11 of 63 Consumer Discretionary companies have reported Q119 year-over-year EPS growth of -0.1%
- 10 of 68 Technology companies have reported Q119 year-over-year EPS growth of -13.1%
- 2 of 28 Utilities companies have reported Q119 year-over-year EPS growth of +14.1%
- 3 of 32 REITS companies have reported Q119 year-over-year EPS growth of +13.0%
Go Utes and REITS! Obviously only 22% of companies reporting doesn’t equate to the end of story.
That said, they tell a story that some people want to (and need to) hear in order to be “right” that the Quad 4 in Q4 smack-down in the US stock market “wasn’t based on fundamentals.”
Here’s the fundamental ROC (rate of change) reality on that:
- #PeakCycle year-over-year EPS growth for the SP500 came in back-to-back quarters (Q2/Q3) in 2018 of > +24%
- During Quad 4 in Q4 the ROC for SP500 EPS growth got CUT in HALF to +12.6% year-over-year
- As of now (Q119) SP500 y/y EPS growth has #slowed from +12.6% to +1.86%
Better than what we expect to happen in the future (down -5-8% year-over-year EPS growth in Q2 and Q3)? Absolutely. A TRENDING re-acceleration in US GDP and EPS Growth? Absolutely not.
This is where the Valuation Experts enter the discussion with important considerations like “what’s been priced in”… and what the “true intrinsic value” of a stock (one they own, of course) is relative to “beaten down expectations”…
I get it. But I also get why the Russell 2000 crashed -27.6% from AUG 30th of 2018 to DEC 24th and is still -8.9% from that #PeakCycle all-time closing high. The Russell obviously isn’t loaded with Quad 3 LONG exposures like the SP500 is.
Then there’s the “Earnings Revisions” debate where a lot of investors rightly focus on the ROC (rate of change) of consensus revisions in “top-down” SP500 earnings forecasts and/or the companies they are long or short of:
A) If the Old Wall’s earnings forecasts are too low, there’s plenty of opportunity for “better than expected”
B) If the Old Wall’s earnings forecasts are too high, there’s plenty of opportunity for “omg, they missed”
Top-down, I’d assign close to a 0% probability that the Financials in particular don’t have down earnings (from the currently booming +1.1% y/y EPS growth rate in Q119) by Q3 of 2019.
But you’ll have to wait until the end of summer of 2019 to hear about me probably being right about that (the probability of most US bank CEOs guiding to my views 6 months out is also close to 0%).
At the same time, I see plenty of opportunity for some of the Energy companies (one of our Top 4 Sector LONGS in Quad 3 alongside REITS, Tech, and Utes) we like to “beat” the Old Wall’s expectation of down -10% y/y EPS growth in Q319.
Yep, I use the ROC to go both ways. And I like it.
Of course, my ROC (rate of change) assumptions for year-over-year SP500 Earnings Growth are driven by the two primary modeling assumptions one would need to have remotely accurate assumptions on the ROC of EPS:
A) Year-over-year GDP GROWTH (as a proxy for demand and revenue growth)
B) Year-over-year INFLATION (as a proxy for cost of goods and EBIT margins)
“So”… as your favorite Old Wall Economists and Strategists like to say before prefacing where they think SP500 Earnings are headed next… we don’t have any credibility or track record in calling The Cycle at the turns…
But we’ll give you a big fat pitch of a SP500 Earnings “forecast” that you can slap a multiple on and find a way to call “cheap.”
I don’t buy or sell “stocks” based on an SP500 earnings multiple, but I can tell you that if you do, you’re buying the SP500 at around 19x earnings (our number, not the Street’s) this morning if that’s what you’re into.
I buy and sell the Sector Styles, Factor Exposures, and Stocks we like based on what economic conditions (i.e. what Economic Quad we’re probably going to be in) we have vs. what certain biased and motivated reasoning would like to always have.
Our immediate-term Global Macro Risk Ranges (with intermediate-term TREND signals in brackets) are now:
UST 10yr Yield 2.46-2.63% (bearish)
SPX 2 (bullish)
RUT 1 (bearish)
NASDAQ 7 (bullish)
Utilities (XLU) 56.80-58.41 (bullish)
REITS (VNQ) 83.73-88.96 (bullish)
Energy (XLE) 66.54-68.86 (bullish)
Financials (XLF) 26.37-27.87 (bearish)
VIX 11.55-15.44 (bearish)
EUR/USD 1.11-1.13 (bearish)
Oil (WTI) 62.45-66.20 (bullish)
Gold 1 (bullish)
Bitcoin 4 (bullish)
Best of luck out there today,
KM
Keith R. McCullough
Chief Executive Officer