“I was living in New York City when I decided to buy an old plantation house in the Mississippi Delta.”
-Richard Grant
For those of you running big money out of NYC this morning, I don’t recommend you move your money management platform to Pluto, Mississippi without a gun and a dog.
The aforementioned quote comes from an eye-opening book that a client recently gave me called Dispatches From Pluto. Channeling his inner William Faulkner he wrote, “to understand the world, you must first understand Mississippi.”
But do we coastal people really understand what’s going on in the guts of America? Do we want to? It’s so much easier to chase a Chinese PMI report than talk about the economic struggle of The People who don’t make what we do.
Back to the Global Macro Grind…
But let’s cheer on that Triple Dovish Fed, devalue the Dollar, and reflate the cost of living in America one more time… and hope that an ISM number that bounces off its recent low is the new TREND as opposed to US Consumption #slowing.

While some of you might appreciate some social compassion, what most of you pay me to do is help you get both the economy and markets right. If you want someone to solve America’s problems, you have an over-supply of cable for that.
So let’s dig into the data dependence of it all and take two important US economic data points from yesterday and contextualize them within The Cycle:
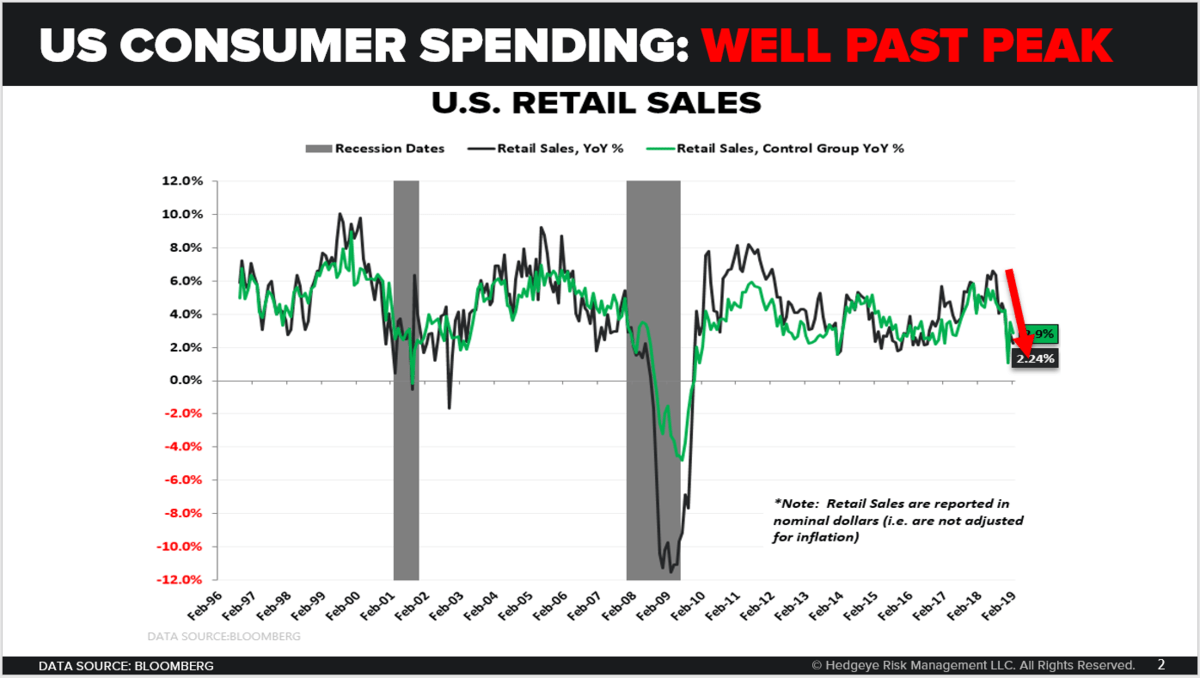
- US RETAIL SALES #slowed to +2.2% year-over-year growth in FEB vs. +2.8% growth in JAN
- US ISM #bounced to 55.3 in MAR vs. 54.2 in FEB
No, the people in the Mississippi Delta and Bridgeport, CT can’t eat an ISM or put PMI in their cars. In context, as you can see in today’s Chart of The Day, that’s a big time slowdown in US Retail Sales from The Cycle Peak of +6.6% in July 2018.
Since JUL of 2018 was part of the #PeakCycle data in Q3 of 2018, here’s a reminder on what peaked:
- US GDP peaked in Q318 at +3.0% y/y
- US headline Inflation peaked in JUL at +2.9% y/y
- US Corporate Profits peaked in Q3 of 2018 as well
Not that the CNBC circus that was pumping people that LYFT IPO at $87/share on the open on Friday would contextualize it for you, but yesterday’s ISM reading of 55.3 for MAR was down from the #PeakCycle print of 60.8 in AUG too.
What’s interesting about all of this pumping, lifting, and dumping is that it’s happening on #decelerating volume. Total US Equity Volume (including dark pool) yesterday was down -12% vs. its 1-month average.
Oh, I know. “The volume doesn’t matter Keith”… until it was #accelerating on the down days during the December stock market crash. But let’s not talk about that. Let’s talk about the upside!
REPLAY: 1 week ago today my Early Look was titled “Decision: Buy/Cover”
Yeah, so I get it. Having covered literally every short I had in Real-Time Alerts when the US stock market was signaling immediate-term TRADE #oversold at the low-end of the @Hedgeye Risk Range, I did what some of you pay me to do.
But, again, who in America is really going to get paid on that?
Forgetting about all of The People (sadly) again this morning, today’s decision is to Sell/Short… not because I’m a mean guy or anything like that. It’s because that’s what my risk management #process will have me do.
And, no, I’m not going to Sell/Short the things I like (many of them, like Treasuries, Gold, Utilities, REITS, etc. were actually on sale yesterday) with the Counter @Hedgeye TREND bounce we saw in bond yields.
The Decision: Sell/Short this morning are in things that fit my A/B test:
A) Is the fundamental research view Bearish TREND @Hedgeye?
B) Is the price of the security at the top-end of the @Hedgeye Risk Range?
I’ll also consider how consensus is pricing the futures & options of those securities in ROC (rate of change terms). Two of those Macro Sell/Short Bearish @Hedgeye TRENDs this morning are:
- The Financials (XLF)
- The Russell 2000 (IWM)
Both the XLF and IWM are within 0.5% of the top-end of their respective @Hedgeye Risk Ranges this morning and both have developed implied volatility DISCOUNTS of -7% and -1% (vs. 30-day realized volatility) in the last 2 trading days.
While it can seem like forever ago (i.e. only 1 week ago) when you had a great buying opportunities, that’s when implied volatilities for the Financials and Russell were trading at “risk on” +10% and +22% PREMIUMS (vs. 30-day realized).
As price, volume, and volatility changes, I do. Over time, if I do that well enough… I have enough to give back to The People who certainly don’t have the resources to either consume and/or understand The Machine.
Our immediate-term Global Macro Risk Ranges (with intermediate-term TREND signals in brackets) are now:
UST 10yr Yield 2.32-2.55% (bearish)
SPX 2 (bullish)
RUT 1 (bearish)
Utilities (XLU) 57.20-59.20 (bullish)
Financials (XLF) 24.77-26.55 (bearish)
VIX 12.50-16.90 (neutral)
USD 95.26-97.33 (neutral)
Oil (WTI) 58.30-61.98 (bullish)
Gold 1 (bullish)
Best of luck out there today,
KM
Keith R. McCullough
Chief Executive Officer