|
TREND WATCH: What’s Happening? With the final results from the 2018 midterms tallied, it’s time to reflect on the winners and losers and what we learned about the state of American politics. The biggest winner may have been democracy: Galvanized by President Trump, voters of both parties turned up at the polls at the highest rates in over a century, with the results illustrating stark partisan gaps by age, gender, race, and education. While the blue tsunami some pundits predicted didn’t materialize, the Democrats performed well: They decisively flipped the House and picked up several governorships, even while Republicans grew their edge in the Senate. Our Take: Will the split leadership usher in a new era of compromise? Not likely. The race exposed an ever-widening ideological gap: Democrats are moving further left, while many of the Trump skeptics in the GOP have been replaced by loyalists. Both sides are already looking ahead to 2020, with the Democrats struggling to manage growing intraparty tensions and the Republicans preparing to play defense amid early predictions of a tough economy. |
MAKING VOTER TURNOUT GREAT AGAIN
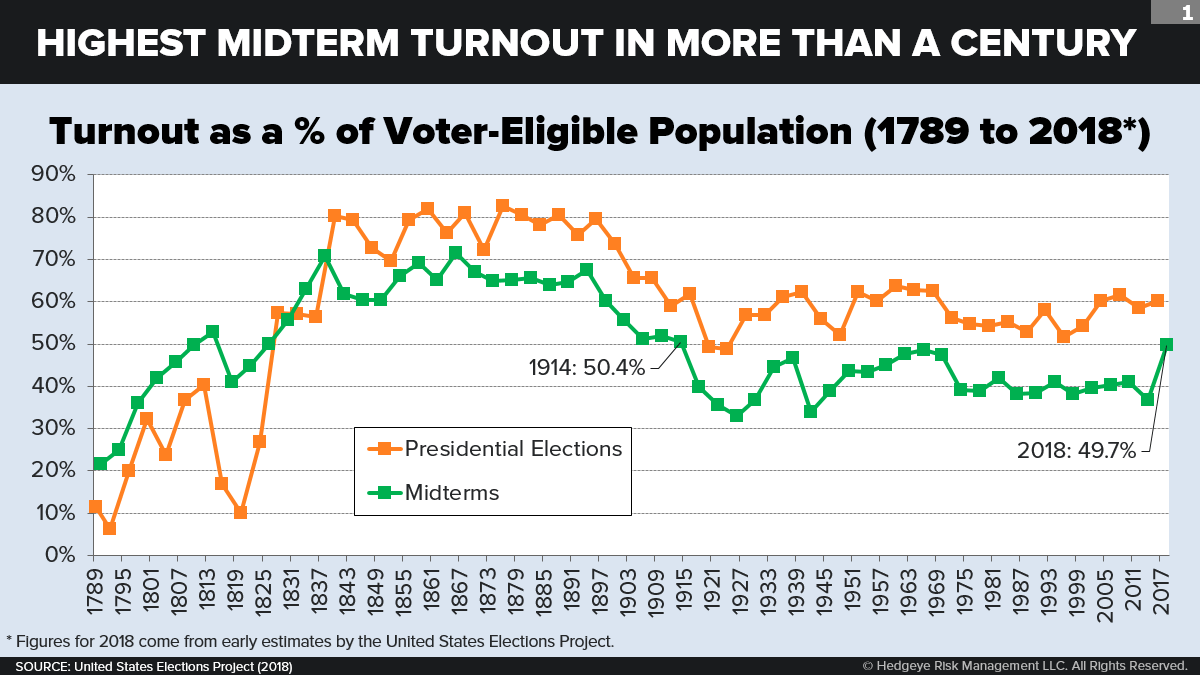
The biggest story of this year’s midterms was the record-breaking turnout. Voter turnout was 42% in the 2011 midterms; it was 37% in 2014. According to early estimates by the United States Elections Project, fully 49% of the voting-eligible population (VEP) cast a ballot in 2018—the highest midterm turnout since 1914. (See: Chart 1 under “Chart Appendix,” found at end of note.) It may also be the highest turnout jump in consecutive midterms in U.S. history. And while turnout saw the biggest surges in states with competitive races like Texas and Virginia, it was also up in places without high-profile contests, like North Carolina.
What, exactly, does this VEP ratio signify? It’s the number of counted ballots divided by the number of Americans eligible to vote—meaning citizens who are over age 18 and without a felony conviction. Not all sources use this methodology: The U.S. Census Bureau typically reports turnout as a share of all U.S. residents of voting age, or as a share of registered voters. (The voting-age measure shows a steeper decline in recent decades due to the rising number of felons.) The VEP is arguably a more meaningful gauge of civic participation since it includes in the denominator only those who could vote.
Pre-election polls presaged voters’ intense interest, with a majority saying that President Trump was the factor driving them to show up. Love him or hate him, no one can disagree that he did wonders for civic engagement. Nearly two-thirds (62%) of Americans believed this election was the most important midterm in their lifetimes. An impressive 93% of voters in battleground districts said their vote mattered just as much as in a presidential election.
Michael McDonald, who runs the United States Elections Project, compared today’s atmosphere to another tumultuous time when turnout surged: 1966. “[That’s] the middle of the civil rights movement. We had Vietnam going on,” he told Vox. “If you look at 2018, that’s your parallel. The country’s doing well economically, but Trump is really driving the conversation. He’s impassioned people both for and against him.”
The high overall turnout rate reflects increased turnout among all age groups. But the rise was especially dramatic among young adults, who showed up in historic numbers. From 2014 to 2018, according to early estimates from CIRCLE, turnout among 18- to 29-year-olds soared 48%, from 21% to 31%. (See: Chart 2.) That’s the highest voting rate in this age bracket in any midterm since the post-Watergate dropoff in youth voting in 1974, and may even be higher than the youth rate in 1966 and 1970. (We’ll know once the official Census figures are released next year.) We’ve long predicted that Millennials would turn out to be a civically engaged generation. They just needed the right impetus.
AMONG VOTERS: RISING AGE, GENDER, EDUCATION GAPS
The results point to stark demographic differences in voting preferences, several of which have widened considerably over the past 20 years. The following voter preferences, unless otherwise mentioned, all come from the massive Edison exit poll sponsored by CBS, NBC, ABC, and CNN. (An alternative AP VoteCast exit poll, sponsored by WSJ and Fox News, shows similar numbers that tip in a slightly more conservative direction.) “White” is used as a shorthand for non-Hispanic white.
By age. The difference in party preference by age was extraordinary. (See: Chart 3.) Voters under 30 supported Democrats by a 2-to-1 margin (67% Democrats to 32% Republicans). The gap in age-bracket preference was equally striking. In 2008, the under-30s' share for Obama was 21 percentage points higher than the over-65s' share. In 2018, the gap was almost as large: 19 percentage points. These are the largest age gaps ever measured for any national election for which we have good age data (that is, since the early 1960s). In comparison, the Nixon vs. McGovern age gap in 1972 was “only” 16 percentage points. (See: Chart 4.) Hard to believe, back in 1994 and 1998, that young Gen Xers actually tipped slightly toward Republican candidates.
By gender. Women favored the Democratic candidate in their district by 19 percentage points (59% to 40%), nearly double the margin by which they voted for Democrats in 2016. Men favored the Republican candidate by 4 percentage points (51% to 47%). (See: Chart 5.) While this gender gap in voting preference (like the age gap) is not entirely new, the 23-point difference this year is the largest it’s been since at least 1992.
By educational attainment. College-graduate voters favored Democratic candidates by 20 percentage points (59% to 39%). Those without college degrees were split between Democrats and Republicans (49% to 49%). All those who have never attended college, or who have only an associate degree, broke for the GOP (48% to 51%). (See: Chart 6.) The education gap in voter preference is going the same way as the gender gap: It’s growing as the result of one group (in this case, college graduates) becoming increasingly aligned with the Democrats. According to analysis by The Wall Street Journal, Democrats hold 81% of House districts with the highest shares of bachelor’s degrees, up from 50% in 1998.
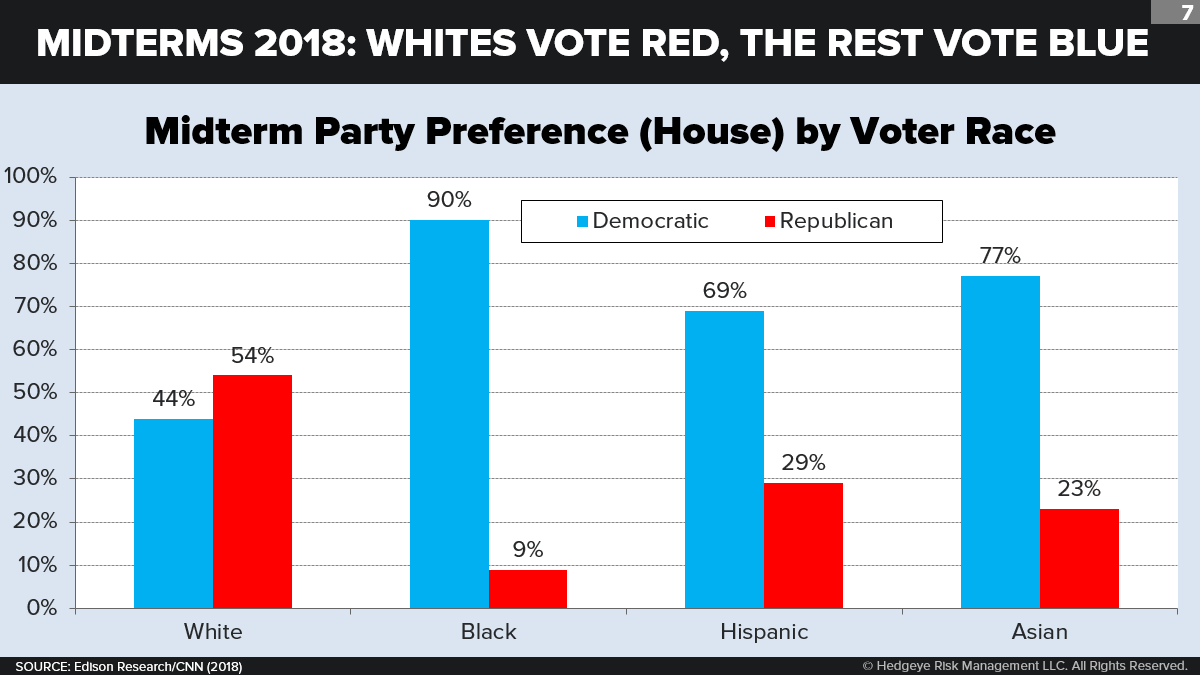
By race. The biggest but least surprising preference gap was by race. (See: Chart 7.) Nonwhite voters went for Democrats by a margin of more than 3-to-1 (76% to 22%), while a slight majority of whites (54%) voted for Republicans. The preference was strongest among blacks (90%), then Asians (77%), and then Latinos (69%). This general partisan pattern is longstanding, except for pro-Democrat tilt of Asians, which is relatively new and growing. (Back in 1996, Asians were least likely to vote Democratic of any racial group, and not until 2012 were they more likely to vote Democratic than Hispanics.)
By income. Yes, there is a partisan split by income: 59% of voters reporting under $50,000 in annual income voted for Democrats, versus 49% of those above the $50,000 threshold. (See: Chart 8.) That’s a 10-point divide. But it’s smaller than just about any other category we’re looking at—much smaller than race or age, smaller than education or gender, and even smaller than Protestant versus Catholic (12 points) or between Catholic versus no religion (20 points). What’s more, this divide is not growing over time. The income gap is smaller in 2018 than it was in 2014 and is not much different from where it was 10, 20, or 30 years ago.
By combination. By cross-tabbing the data, we can see how some of these categories interact. Every white age bracket over age 30 broke for the GOP, showing (in this case) how race and age balance. White women split just about evenly between parties, showing how race and gender balance. Gender makes only a modest difference in voting for those who don’t have college degrees, but for those with college, graduate, or professional degrees, there’s a yawning chasm: According to the AP VoteCast exit poll, postgrad men voted only 50-47% for Democrats, while postgrad women voted 68-30% for Democrats. Meanwhile, whites with no college degree split by 20 percentage points for the GOP.
IN THE FRESHMAN CLASS: RISING GENDER AND RACE GAP
The newly elected Congress also reflects growing diversity gaps between Democratic and Republican representation.
- By gender. Only 9% of the Republican members-elect (2 out of 7 in the Senate, 2 out of 37 in the House) are women. Due to defeats and retirements, the total number of GOP women House members cratered, from 23 to 13. By contrast, 58% of the Democratic members-elect (3 out of 3 in the Senate, 35 out of 63 in the House) are women. (See: Charts 9 and 10.) This election saw the biggest jump in the number of new women voted into the House since 1992—and all but two are Democrats.
- By race. Only one of the 44 Republican members-elect is nonwhite. In comparison, one-third of the Democratic members-elect (22 out of 66) are nonwhite.
BLUER SUBURBS, REDDER COUNTRYSIDE
The same geographic divides that helped determine the 2016 election have only strengthened.
- Rural areas got redder. Republicans remained dominant in rural and small-town America, inhabited by Americans who tend to be older, whiter, and less educated. They handily picked up new Senate seats in North Dakota, Missouri, and Indiana—which rank among the more rural states (the 10th, 21st, and 23rd most rural, respectively, as a share of population). Meanwhile, Democrats picked up Senate seats in Arizona and Nevada, among the most urbanized states in America (40th and 48th, respectively), since few of their residents live outside big urban centers like Las Vegas and Phoenix. Florida was the outlier. Though a fairly “urban” state as defined by the Census (it’s the 43rd most rural), the Republicans managed to eke out a narrow victory by rallying the rural panhandle and expat seniors over the densely populated urban areas of Miami, Tampa, Orlando, and Jacksonville.
- The suburbs got bluer. On the flip side, Democrats remained dominant in cities and strengthened their hold on the suburbs. In the 24% of all House seats that are pure urban (nearly all Democrat) or pure rural (nearly all GOP), there was almost no turnover. In the further 37% of all House seats that lean mostly urban or mostly rural, the Democrats picked up a net eight seats. But in the remaining “suburban” seats, that tend to be more evenly split, the Democrats picked up a net 27 seats. (See: Chart 11.) Most of these are relatively affluent “purple” suburbs that once voted for Mitt Romney and may or may not have voted for Trump in 2016. We’re talking about the Orange County suburbs of Los Angeles (where the Democrats flipped four seats), plus the suburbs Chicago, Atlanta, Austin, Charlotte, Chicago, Denver, Minneapolis, and several other cities.
The growing alignment between region, demography, and party preference means that Americans are becoming ever-more likely to be represented by a party that “corresponds” with their race or ethnicity. Most white Americans will be represented by a Republican in the House, while at least two-thirds of black, Hispanic, and Asian Americans will be represented by a Democrat.
GOP TURNS TRUMPIER
In playing to his deep-red base, Trump has been successful in turning the split between Republicans and Democrats into a split about him. The districts that the GOP won were ones that voted for Trump in 2016, rather than districts that historically belonged to the GOP. Most of the districts lukewarm on Trump flipped to Democrats: Of the 47 districts where Trump took less than 51% of the vote in 2016, Democrats won 34 of them.
What this means for Congress is a smaller, more conservative, and Trumpier GOP caucus. Incoming Republicans are bullish on the president, and his dissenters have quieted down. Most of Trump’s harshest Republican critics, such as Jeff Flake, Bob Corker, and Mark Sanford, announced their retirements or failed to win their primaries. Former rivals like Mitt Romney and Ted Cruz have fallen in line with their colleagues. While moderate Republicans haven’t gone extinct, their voices will likely be diminished.
DEMOCRATS DRIFT LEFT
In recent years, the Democratic agenda has moved steadily leftward. Policies that used to be considered fringe, such as single-payer health care, tuition-free college, or a jobs guarantee, entered the mainstream in 2016 with Bernie Sanders’s campaign and have been bolstered by progressive Millennial media stars like newly elected congresswoman Alexandria Ocasio-Cortez.
Not many leftist challengers have actually been elected. High-profile candidates like Florida’s Andrew Gillum and Georgia’s Stacey Abrams, both of whom were endorsed by Sanders, lost. Nevertheless, their rhetoric is coming to define the party, because establishment Democrats who once defined the center, like Joe Manchin, Kirsten Gillibrand, Jean Shaheen, and Cory Booker, are embracing it. Even Obama endorsed Medicare for all in a get-out-the-vote speech earlier this year. Democrats are also increasingly hostile to big money, with candidates who used to cozy up to Wall Street interests now rejecting corporate donations and calling for tighter financial regulation. The Obama- and Clinton-era comfort with Wall Street is today recalled with embarrassment. The movement leftward sets the stage for tension between not only Democrats and Republicans, but also between progressive Democrats and the still-centrist old guard.
DEMOCRATS WEAKEN THE GOP’S STATE-LEVEL DOMINANCE
The Republicans came into this midterm possessing a historic hammerlock on state governments. Thanks to huge wins in the two prior (Obama) midterms, the GOP held 33 governorships and both legislative chambers in 32 states. Last month, the Democrats reduced the GOP governorship count to 27. (They would have cut it all the way to an even 25 had they not lost the two very close races in Georgia and Florida.) Their gains in state legislatures were less impressive: Democrats’ seat share in statehouses grew by 4.6%, which is just under the historical average for the opposition party in midterm elections (5.0%). GOP control of both legislative chambers was only reduced from 32 states to 30—which Republican leaders have to regard as a win.
At the same time, the Democrats did succeed in switching several divided-chamber states (Colorado, Connecticut, and Maine) to Democrat-only control. Only one state is left with divided chambers (Minnesota). This may be without historical precedent: Going back to 1938 (as far as Census has published a count), there have never been fewer than three states with divided chambers. (See: Chart 12.) Also, by unifying control over the governor’s mansion and both state legislative chambers in six states, they raised the total number of states under full Democratic control to 15. (The GOP retains full control of 21.) The number of “split” states—in which both chambers and the governor don’t belong to the same party—thus falls to 14. This is near a historical low. Since 1977, the split state count has only sunk below 22 in the last decade; and it has only been below 14 twice, in 2013 and 2014. (See: Chart 13.)
Both of these trends point ominously to the growing regionalization of red-versus-blue partisanship in America.
National parties care about state victories for many reasons. They want to familiarize voters with their brand. They want to implement their “blue” or “red” policy agenda. And above all, they want on-the-ground clout over any decision affecting national elections, from redistricting to voter qualifications to counting the vote. The Democrats should be happy, in this respect, that they won the governorships of four swing states (Michigan, Wisconsin, Nevada, and Maine). They surely wished they could have taken Florida as well, but alas, they left those 29 electoral votes to the tender mercies of a rabidly pro-Trump governor-elect (Ron DeSantis).
SCORECARD: SO WHO WON?
Who won, and who lost? The answer depends on how you interpret the results.
- The popular vote. Democrats won the popular vote again, with a margin that keeps increasing as the final tallies come in. Latest count: 53.4% of the House vote to the Republicans’ 44.8%. This 8.6% margin is much higher than the two-point margin the Democrats gained in 2016, when Clinton received 48% of the vote and Trump 46%. It’s also higher than the 6.8% “shellacking” that the GOP Tea Party gave the Democrats in 2010. Yet in that election, the GOP picked up 63 seats! So once again, the Democrats feel frustrated—this time that their margin translated into modest gains in the House (thanks partly to gerrymandering by GOP-led states) and actual reversals in the Senate (thanks mostly to the brute facts of the federal constitution and demography).
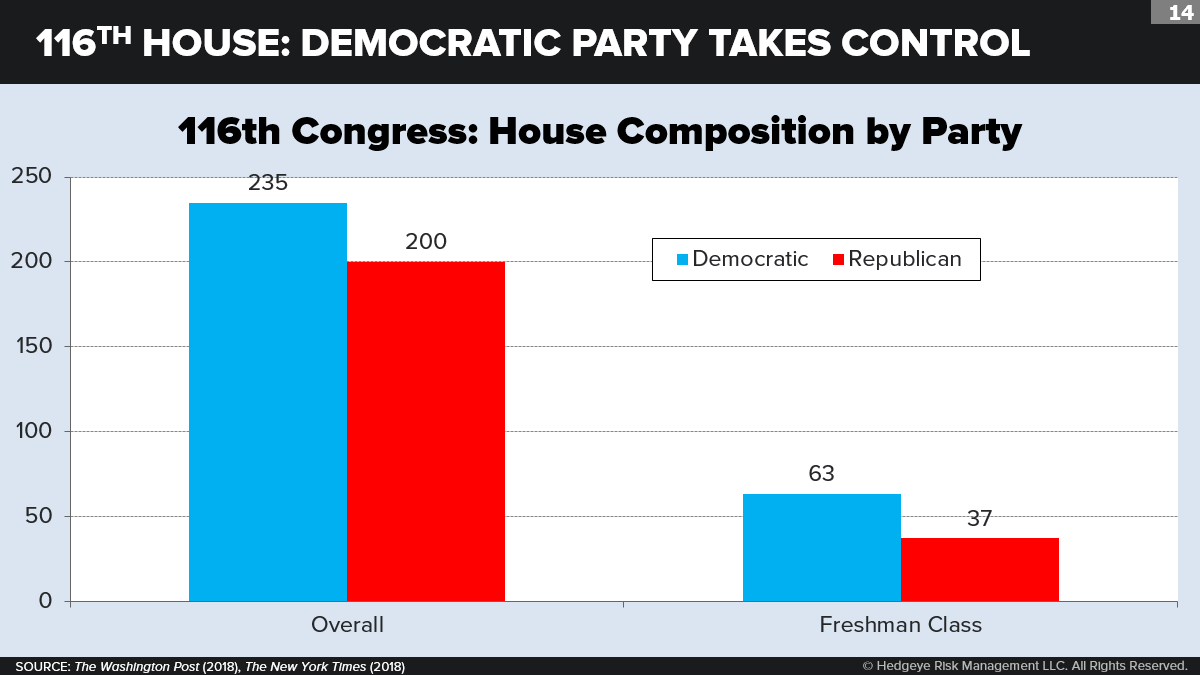
- Total share of seats. In the House, Democrats’ numerical advantage went from 5% down (-23 seats) to 4% up (+16 seats). In the Senate, Republicans’ advantage grew from 1% to 3% (+2 seats). (See: Charts 14 and 15.) On the surface, these results look like a net win for the Democrats. Yet losing the House may not make a major difference to Republicans, who started out with only a modest advantage there anyway. It has been their razor-thin Senate margin that has recently caused them the most heartburn. They’ve lost the House, but in return, they have a much more reliable bloc in the Senate that can be counted on to confirm executive appointments and ally itself with Trump in dealing with the House over the next two years.
- Historical precedents. Generally speaking, the Republicans’ performance was in line with historical trends. Since 1946, the party of a sitting president with an approval rating below 50% has lost an average of 37 House seats in midterm elections. Republicans lost 39. It is unusual for the chambers to move in opposite directions like they did this year, which has only happened 10 times since 1926. But the Republican gains were more reflective of how difficult the Senate map was for Democrats than anything else.
- Money spent. According to the Center for Responsive Politics, this was by far the most expensive midterm race in history, with an estimated $5.2 billion spent. Compared to 2014, that’s a 35% increase overall and a 65% increase in nonparty “outside spending.” Maybe the Democrats want to rethink their position on campaign spending limits, because they ended up outspending the Republicans in both the Senate and (especially) the House—and, in keeping with trends from past elections, the candidate who spends the most usually wins. The exceptions include Beto O’Rourke in Texas and Heidi Heitkamp in North Dakota, who lost despite massively outspending their opponents. Some Republicans take solace that what beat them was not so much a “blue wave,” but a “green wave.”
OUTLOOK
What’s in store for the new Congress in the months to come?
Lots of digging in. Let’s be clear about one thing: Few Americans have changed their minds since 2016. According to the AP VoteCast exit poll, 91% of voters who went for Trump in 2016 voted for the GOP in 2018, and 94% of voters who went for Clinton in 2016 voted for a Democrat in 2018. Yes, Democratic voters dislike Trump more than Republican voters like him. That explains Trump’s low approval ratings. But faced with the alternative, the vast majority of Republicans and Republican-leaning independents will vote for him anyway. During the campaigns, each party showcased utterly incomparable agendas: The Democrats touted action on health care; the GOP touted action on immigration. Both appeal to most voters. But each appeals to an entirely different social need—and maybe even a different part of the brain. Expect little meaningful communication on either issue.
Continued dysfunction. When Congressional leadership is split, the most common result is gridlock. The growing ideological rift between the parties also doesn’t bode well for cooperation on issues like the budget or tax policy. Nor do Democrats' plans to launch multiple investigations related to everything from immigration policy to nepotism to Trump’s tax returns. Thanks to rule changes since the late 1990s, the party that controls the House has gained increasing subpoena power, which Democrats will use to their full advantage now that they hold the reins.
Limited room for bipartisan deals. A split Congress does present certain opportunities. Trump, who has often shown how willing he is to depart from GOP orthodoxy, could decide to triangulate. A Democratic-controlled House might enable him to display his inner populist and broker deals on issues like improving infrastructure, lowering drug prices, favoring school vouchers, or reforming criminal justice—rifle-shot actions that don’t offend the core policy commitments of either side. Given that Trump is the most popular politician within the GOP base, indignant Senate Republicans will have little choice but to go along with these deals.
Intraparty tension among Democrats. The biggest issue facing Democrats may be figuring out how to effectively govern their own party. The resistance Nancy Pelosi has faced in her bid to become speaker has her cutting deal after deal to appease younger members, which risks giving away too much of her authority.
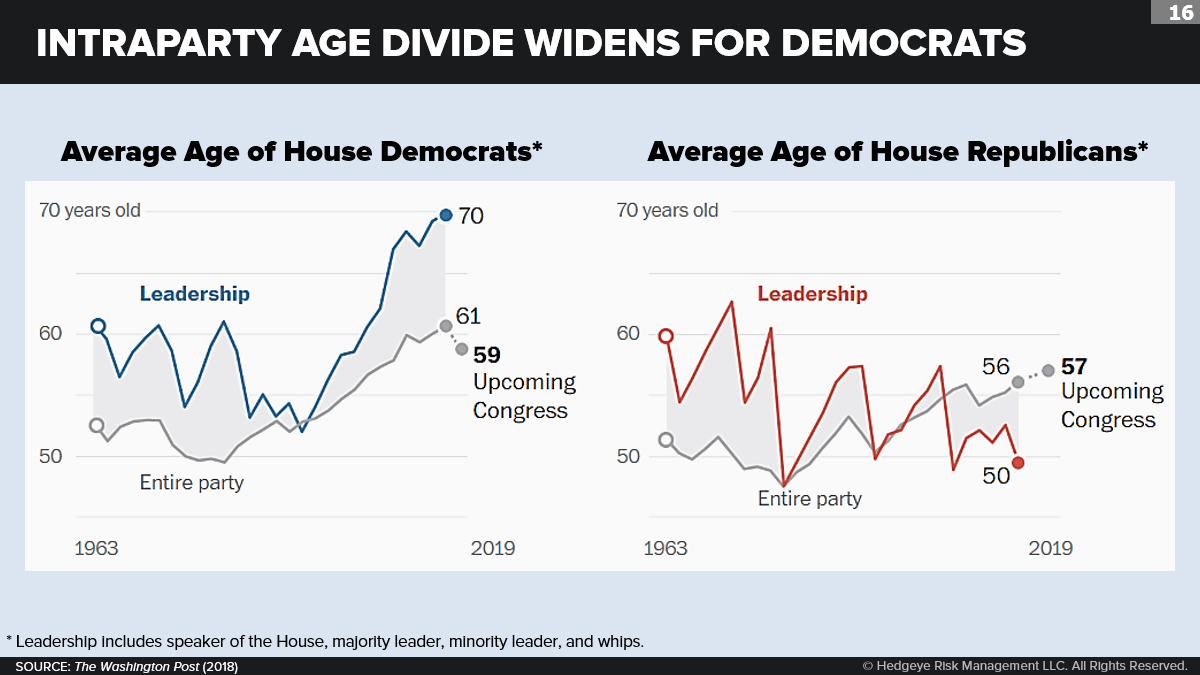
Underlying the rebellion is a powder keg weighing on the Democrats: the enormous age divide between the party’s leadership and its incoming members, which is the widest it has been in more than 50 years. (See: Chart 16.) The Democratic House leadership is dominated by early-wave Boomers and Silent, who dwarf the ranks of late-wave Boomers and Gen Xers. Now they’re welcoming dozens more Xers and their first sizable group of Millennials, bringing down the average age of House Democrats from 61 to 59. By comparison, the average age of Democratic leadership is 70. Democrats have defined themselves as the party of diversity and progressive change, but they’ve yet to match this in their own ranks.
LOOKING AHEAD TO 2020
Although the dust has barely settled from 2018, pundits and commentators are already teeing up for the next election.
For the Republicans, the next two years are mainly about defense. GOP leaders have little choice except to go with Trump in 2020 and defend their Trump-era accomplishments (on tax reform and regulation) and their future aspirations (say, on immigration). History affords no example of a party thwarting the desire of its incumbent president to run again. And it affords only two examples of a party winning the next presidential election after its incumbent voluntarily decides not to run again. One was John Adams succeeding George Washington, which is probably not relevant today. The other is Herbert Hoover succeeding Calvin Coolidge, which—should Trump decline a second term—is not a happy precedent for Marco Rubio or John Kasich or Ted Cruz.
For the Democrats, the next two years are mainly about offense. All the initiative is on their side—too much initiative, perhaps, for them to handle. As yet, the Democrats are nowhere near a consensus on a national policy message for 2020, nor on a plausible presidential candidate who can unify the party around such a message. As the Democrats try to move beyond a mere anti-Trump agenda, they will have difficulty unifying a party that extends (in the Senate) from centrists like Joe Manchin and Amy Klobuchar to firebrands like Kamala Harris and Sherrod Brown. They may also struggle to bridge a vast age gap that extends (in the House) between senior members who attended JFK’s inauguration and newly elected members who cannot recall Monica Lewinski.
At the moment, given the popular vote outcome in the midterms, the Democrats—whichever candidate they choose—are the likely favorite to win the White House in 2020. (The current market odds are 58-42%.)
But of course a lot of things could happen over the next two years. What things matter most? History suggests that the GOP would be most helped by a strengthening economy and (to a lesser extent) by significant geopolitical challenges. The reverse scenario, on the other hand, pushes the odds further toward the Democrats.
This poses a real challenge for the GOP, since it is hard to imagine the economy performing much better at this point in the business cycle. It is much easier to imagine, sometime before the fall of 2020, a cycle-ending recession and a matching equity bear market. According to the latest Blue Chip forecast, more than a third of top economists predict the economy will be in recession in 2020. The November Merrill Lynch survey shows 44% of investors expecting slower global growth in 2019—the highest share since November 2008. Our own look at the yield curve suggests that an inversion by this winter would likely trigger a recession at the worst possible moment for the Republican Party.
If the economic and market downturn is severe, the Democrats may both run and win—across the board—on a very progressive social and economic platform. With aggressive leadership, they might go all out in pursuit of their goals by enacting “nuclear option”-style rule changes, such as ending the Senate filibuster entirely and packing the Supreme Court with progressive justices. A vast shift in tax and benefit and regulatory direction could be legislated through Congress on simple majority votes. A new wave of radicalized Millennial freshmen would regard themselves as foot soldiers in America’s next New Deal. Clearly, this would be the worst-case outcome for the Republicans.
If the downturn doesn’t happen or is less severe, then the GOP’s chances improve considerably. While retaking the House may be beyond their grasp, the Republicans’ regional advantage by state may be enough for them (once again) to weather a popular-vote defeat while still retaining either the Senate, the White House, or both.
This is the cruel math for the Democrats. Despite their growing popular margins in coastal and midwestern blue-zone states, they will not capture either the Senate or the White House until they figure out how to win over some red states. Winning red states, in turn, would require them to push a populist economic agenda (including perhaps a Medicare buy-in, a higher minimum wage, and more progressive tax rates), which polls favorably in the heartland, rather than a progressive cultural agenda (like abolishing ICE or rolling back school choice), which does not. And what makes it more likely that the Democrats will prefer pursuing an economic agenda? Almost certainly, an economy that is in bad shape.
So once again it comes back to economic performance. If the job and GDP and S&P numbers remain positive, no amount of scorched-earth rhetoric or anti-Trump subpoenas and investigations are likely to do the Democrats much good. But if they go deeply negative, new vistas may open up for them—and 2020 could become a date that the party of Franklin Roosevelt may recall fondly for generations.
CHART APPENDIX