CHART OF THE DAY: Earnings Slowing
02/20/19 07:38AM EST
Editor's Note: Below is a chart and brief excerpt from today's Early Look written by Hedgeye CEO Keith McCullough. Click here to learn more.

|
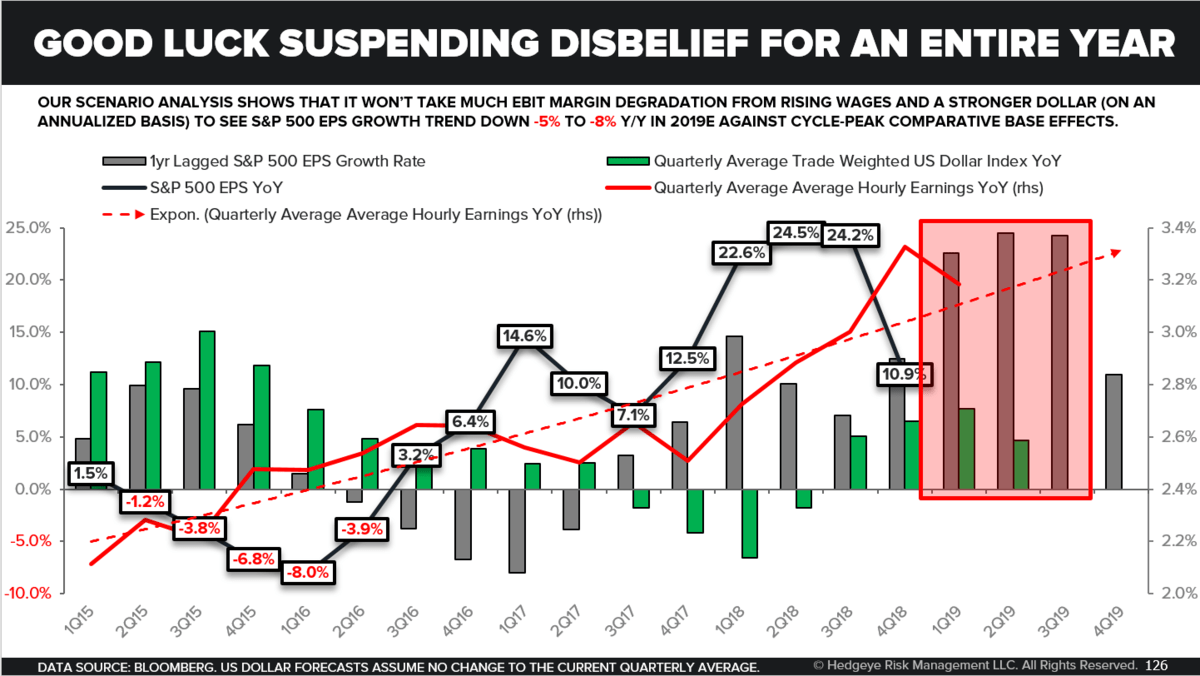
How about the real-time ROC (rate of change) on Q418 US Earnings Season?
- 412 of the SP500’s companies have reported aggregate year-over-year EPS growth of +10.85%
- That’s the slowest growth rate of the Q418 Earnings Season (it was tracking +12-14% prior)
- That’s #slowing, big time, from the #PeakCycle EPS growth rate of +24-25% in Q2 and Q3 of 2018
But no worries, with 3 of the 10 SP500 Sectors already showing NEGATIVE year-over-year earnings growth, this must “all be priced in” without having had to lap the toughest compares since Q3 of 2000 (+23%) six-to-nine months from now.
|

© 2024 Hedgeye Risk Management, LLC. The information contained herein is the property of Hedgeye, which reserves all rights thereto. Redistribution of any part of this information is prohibited without the express written consent of Hedgeye. Hedgeye is not responsible for any errors in or omissions to this information, or for any consequences that may result from the use of this information.