"Not everything that counts can be counted. Not everything that can be counted counts."
-Albert Einstein
In math an isomorphism is, formally, a bijective morphism that preserves sets and relations among elements.
And because the 1st rule of Early Look club is to never start a missive with a crappy esoteric sentence that instantly disaffects your audience …. here’s some throwback visual penance (Humpday Camel)
Now, more generally, an isomorphism is meant to describes a notion of sameness – an idea that if ostensibly different problems can be reduced and represented in the same way, they are really the same problem and you can develop a generalized model that can be applied to both.
As I highlighted last week and Keith highlighted again yesterday, macro investing can be sufficiently distilled to divining 2nd derivative trends.
It is, fundamentally, a question of forecasting and frontrunning better/worse, acceleration/deceleration.
Core to our conceptual framework is the contention that asset price movements, inclusive of all their dynamism, vagaries and convoluted and variable interdependence, remain a function of the prevailing growth and inflation regime, particularly over the Trend duration.
As simple as that is, the implications are profound as it means the ostensibly heterogenous problem of picking among all the different asset classes, globally, can be reduced and represented in a single unified framework - meaning that the ‘problem’ of how to choose among a dizzying multitude of investment options is all really the same problem and a generalized model can be effectively developed and applied.
The art remains in conceptualizing a novel framework – then figuring out how to dynamically measure, map, and operate inside of it.
Policy, for its part, both shapes and responds to the extant growth/inflation environment and the market’s pricing of both in a variable, two way communication loop …. active participant, passive observer, both and neither.
The Fifty Shades of Powell have been on discrete display over the last month+ as the Fed worked to craft their rhetorical pivot in the face of persistent Quad 4 data. We’ll get another different but same incarnation alongside this week’s big event, non-event policy decision.
Now, as it relates to both binary outcomes (better/worse, acceleration/deceleration) and two-way communication loops (Fed/Markets, us/you), and because we still consider Hedgeye a real-time experiment in investment research democratization, I’m going to open it up to some audience participation.
For all the data science and polymath’s who are on the distro and populate our twitter feeds, think of it as a kind of macro analytic gamification.
Here’s the classification challenge:
- Objective: Forecast whether growth in each of the next 4 quarters is going to accelerate or decelerate (Better or Worse from a 2nd derivative perspective)
- Use a logistic regression model and push it through a neural network or other classification algo with the output classification simply: 1 = better/acceleration, 0 = worse/deceleration
- Use whatever number of inputs you want
- Show both the training data and the test/cross-validation data.
… the carrot will be some Hedgeye schwag or a free subscription of some sort.
I’m throwing this out there because our audience is informed and engaged and because it’s such an obvious, rough exercise in simplifying the complex that I can’t believe I haven’t actually done it already.
Complex, Simple, both and neither.
Back to the Global Macro Grind …..
Perhaps a more challenging exercise would be to identify an industry that is more pervasively overfed and undernourished than fintwit and financial media more broadly. Particularly over the last month.
Indeed, when the pundit-verse is singularly equipped with a data opining hammer but there is no data being released, they will invariably find some nails … even if it means hammering down the signal-to-noise ratio.
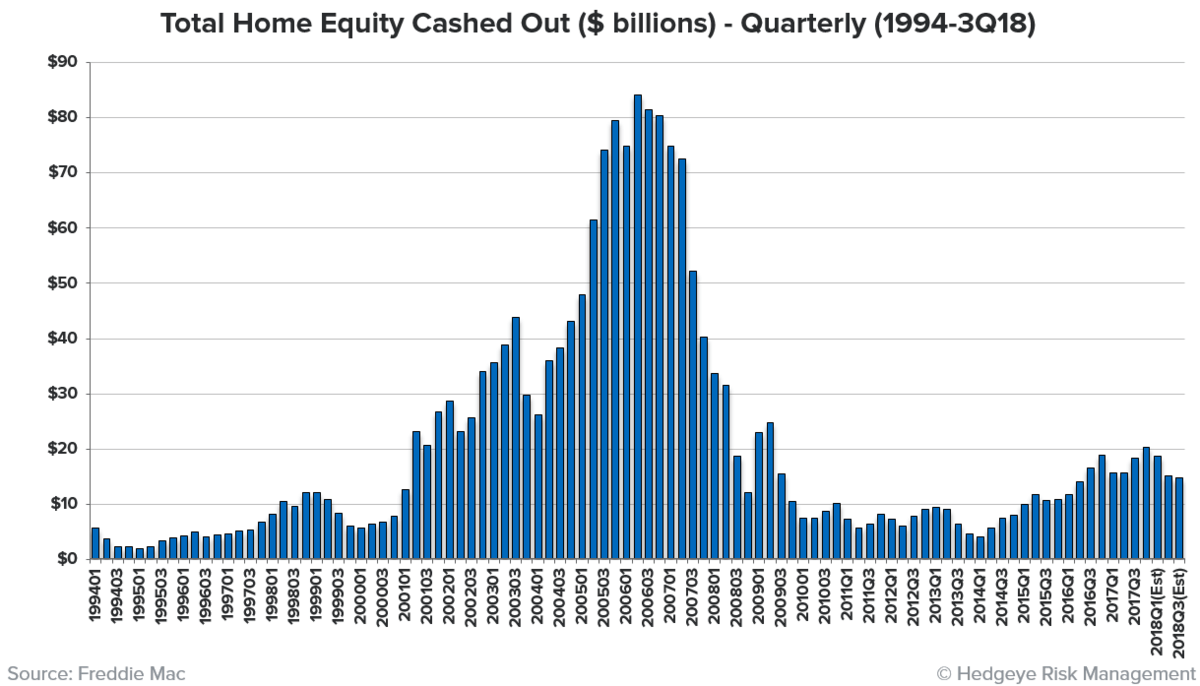
For example, we’ve been recurrently asked about the following housing chart which shows the percent of refi’s that are taking cash out.

Pretty ominous, eh? …… looks like bubble territory to me and we know how that ended last time!
What’s critical to understand and what is (purposefully) left uncontextualized is the denominator in that ratio.
- First, while the share of cash-out refi’s is high the total number of refi’s has completely collapsed. Total refi activity is running 50% below what we saw during the 05-07 period.
- This second point follows from the first: cash-out refi home equity withdrawal amounts reached obscene levels in the 2005-2007 period, averaging $70-80 billion per quarter. Currently levels are in the $10-20 billion per quarter range, and that's not adjusted for inflation, which means today's equity extraction is still running below 1/5th of what occurred during the bubble.
- Below is the amount of cash-out refi activity, in actually dollars.
Remember how - before resigning and in an amusing but tragicomical commentary on the prevailing state of conditions - John Kelly contended that what he accomplished should be measured in units of what did not happen. In other words, what whimsical, half-baked initiatives he stopped before they were executed on.
The cash-out refi chart is kind of like that. It’s what you don’t see that matters.
Let me quickly move through the rest of the blocking and tackling:
- Home Prices: Case-Shiller HPI showed home prices slowing -33 bps to 4.69% Y/Y, marking an 8th month of deceleration and the slowest pace of growth in 4 years. Remember the temporal flow of what is going on here: Twin rate shocks in 2018 drove a decline in transaction activity → sellers changed their behavior and cut listing prices on a lag → this shows up in closed transaction prices and the official HPI data on a further lag. Remember also, Case-Shiller is calculated as three-month moving average and yesterday’s data was for November (It’s now February!) In other words, the ‘latest’ data effectively reflects supply-demand-affordability conditions in the housing market almost two quarters ago. In other words, expect the deceleration to continue as last year’s dynamics continue to flow through the reported price data.
- Pending Home Sales: We’ll get the Pending Home Sales (signed contract activity) data for December this morning which will give us the lead read on Existing Home Sales for January. While we expect another iteration of underwhelming, we will be more interested to see if next months data do, in fact, accord with the weekly Purchase application data for January (in the wake of the collapse in rates in Dec/Jan) which has seen Purchase volumes rise +12% M/M and +17.4% off the October low.
- Confidence: The Confidence cratering continued apace in January as the Conference Board Consumer Confidence series followed the University of Michigan’s January reading in fully retracing the post-election/tax reform/record streak of growth ebullience. Unsurprisingly, Forward Expectations were the primary driver of weakness as continue labor market tightness was not enough to staunch sentiment souring in the face of rampant volatility clustering, acute market structure fragility, cratering asset prices, slowing global growth, incremental political gridlock, and government shutdown angst.
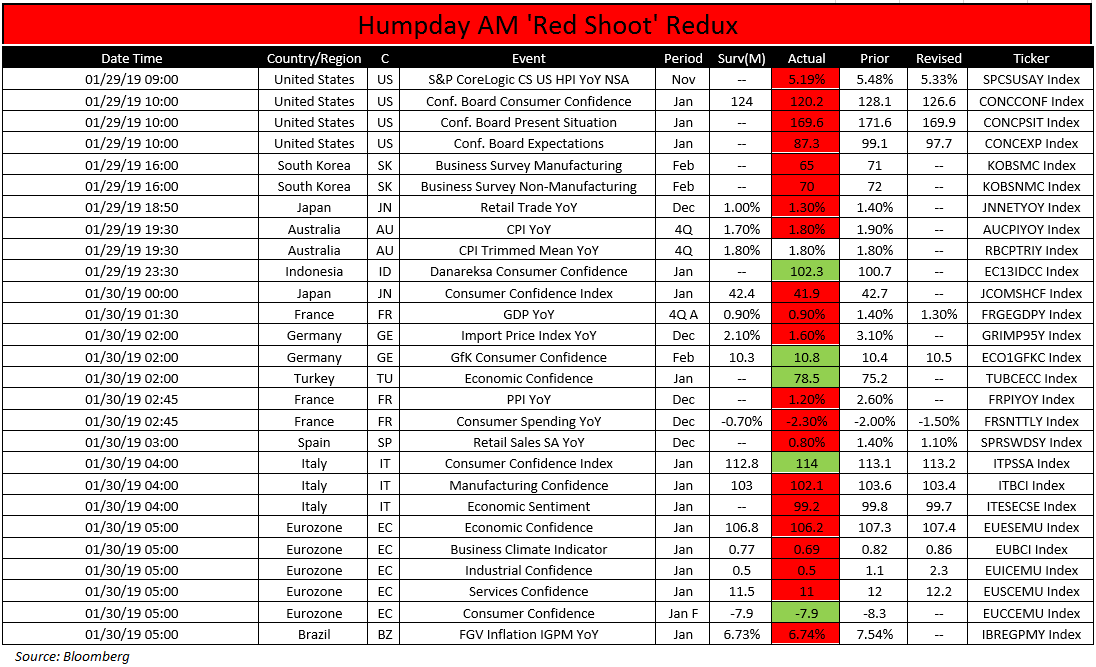
The rest of the AM run through doesn’t really need fabricated contextualization so I’ll simply point you to the Chart of the Day below for the Eurozone data redux.
Suffice to say, “worse” continues to characterize Draghi’s EU growth reality and remains part and parcel of the push-pull topping process for the Dollar.
With American Exceptionalism (i.e. discrete growth & policy divergence) now rearview, it’s a game of relatives and who gets worse, faster, from here will remain our daily data mapping and risk management exercise.
Our immediate-term Global Macro Risk Ranges (with intermediate-term TREND views in brackets) are now:
UST 10yr Yield 2.65-2.78% (bearish)
SPX 2 (bearish)
Utilities (XLU) 52.13-54.25 (bullish)
Industrials (XLI) 67.17-70.96 (bearish)
Housing (ITB) 31.90-33.44 (bullish)
DAX 109 (bearish)
VIX 17.01-22.66 (bullish)
USD 95.00-96.35 (bullish)
Oil (WTI) 50.66-54.32 (bearish)
Gold 1 (bullish)
Happy humpday hunting,
Christian B. Drake
U.S. Macro Analyst