CHART OF THE DAY: Are You Long Housing Yet?
01/25/19 08:41AM EST
Editor's Note: Below is a brief excerpt from today's Early Look written by U.S. Macro analyst Christian Drake. Click here to learn more about the Early Look.
|
If you’re not a visual-phile, the summary is this:
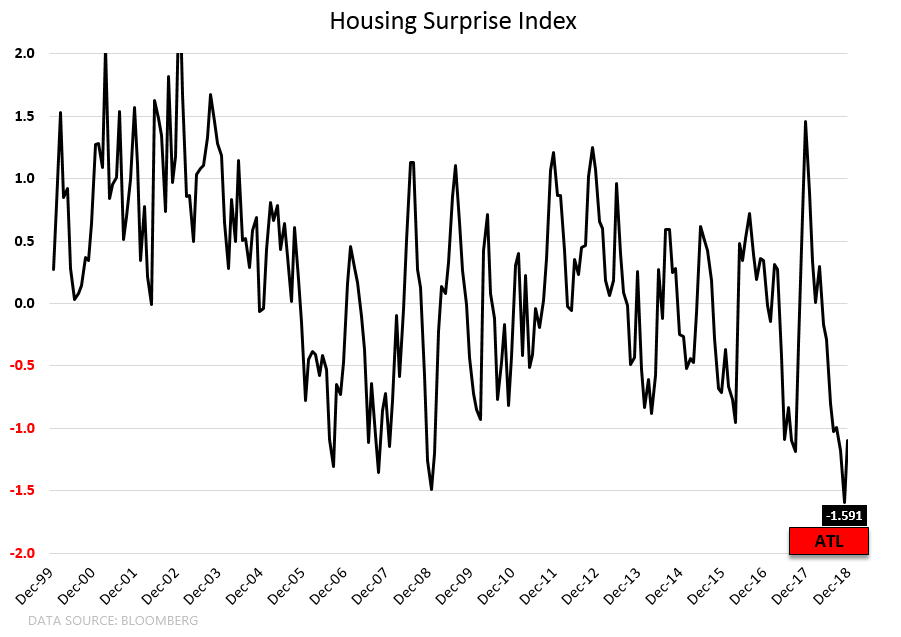
- Housing Surprise Index = All-time low
- Existing Home Sales = -10% Y/Y = worst since 2011 (2011 was when we comped the housing tax credit related pull forward in demand)
- Housing Relative Performance = ↑
- January Mortgage Purchase Applications = ↑ (on a short lag to falling rates)
... In essence, it’s not more complicated than that … and the procession of dynamics above is why you’ve seen housing outperform over the last 1-2 months in the face of some of the worst fundamental data of the cycle.
|


© 2024 Hedgeye Risk Management, LLC. The information contained herein is the property of Hedgeye, which reserves all rights thereto. Redistribution of any part of this information is prohibited without the express written consent of Hedgeye. Hedgeye is not responsible for any errors in or omissions to this information, or for any consequences that may result from the use of this information.