
"Fate, it seems, is not without a sense of irony”
-Morpheus
Looking Better, Living Longer, Having More ….
Almost without exception, every New Year’s Resolution can be bucketed into one of those 3 broad categories.
The macro-ticians @Hedgeye, we humbly concede, are no exception.
More data, more machine learning, more measuring, more mapping, more innovation, more meritocratic analytical mojo.
That ‘Having More’ constellation remains our collective aspiration in 2019.
I suppose, by definition, that makes us greedy.
We want more, don’t think any less of us.
Back to the Global Macro Grind…
More, as it turns out, carries a bit of tragicomical irony in a year we expressly expect to be conspicuously characterized by less.
Just to pick a recent few off a deep rate-of-change deceleration bench:
- China: _______ (Insert Metric of choice) = worst since Industrial/Profit recession in 2016.
- Japan: Machine tool Orders growth = global manufacturing activity proxy = -18.3% Y/Y .
- South Korea: South Korean Export Growth → global supply chain juggernaut and all around global macro canary = -14.6% Y/Y
- France: French PMI = full contraction mode = 47.5 = 59-month low = assuaging precisely zero concerns around rising prospects for outright contraction in 1Q.
- Germany: German Industrial Production = -4.7% Y/Y = worst since 2009 and allaying no angst around Draghi normalizing into rising Eurozone Recession Risk.
- Australia: Home Price Growth = -1.9% Y/Y and slowing as the confluence of domestic imbalances and Chinese macro malaise put the multidecade expansion on increasingly precarious footing.
Of course, ‘More’ is generally relativistic and Pareto constrained in the sense that an explicit objective/consequence of having more of one thing is to have/drive less of another:
More exercise ≈ less disease, more credit/debt today ≈ less household consumption tomorrow, more growth now ≈ less base effect support next year, more xenophobia ≈ less immigration, ..…
More Quad 4 data ≈ more bad ≈ more cowbell ≈ more asset price reflation hopes ≈ less is more …. You know the post-crisis bad is good market ethos.
MORE and LESS, fated to be forever and co-dependently locked in an embrace of metaphysical irony, but I digress.
Let’s just look at some pictures instead, shall we. I mean, c’mon dude, it’s Friday, enough with the shallow #DavosMan philosophizing.
Housing remains the quintessential case study in less-is-more ironies here currently:
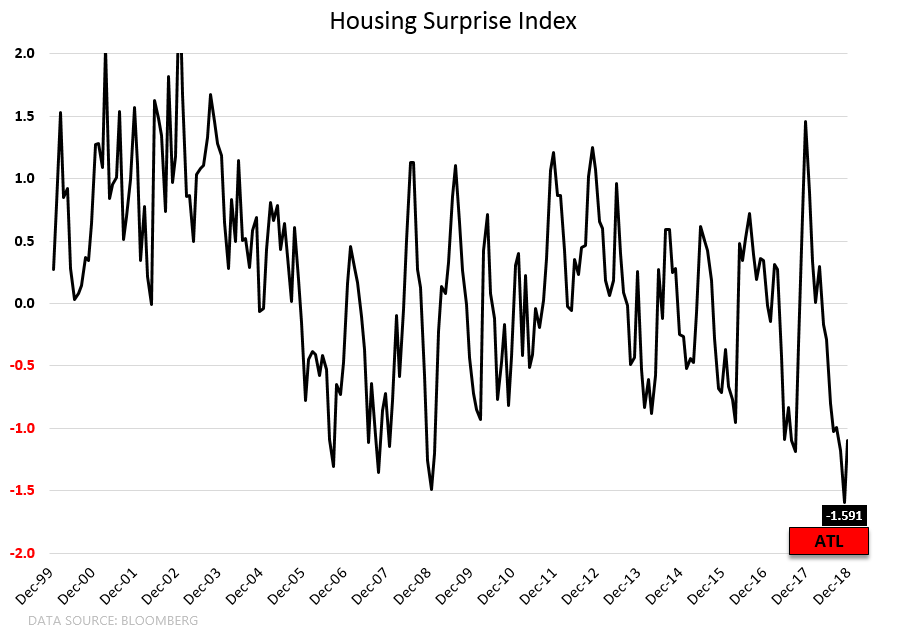


If you’re not a visual-phile, the summary is this:
- Housing Surprise Index = All-time low
- Existing Home Sales = -10% Y/Y = worst since 2011 (2011 was when we comped the housing tax credit related pull forward in demand)
- Housing Relative Performance = ↑
- January Mortgage Purchase Applications = ↑ (on a short lag to falling rates)
And if you’re not a bullet point-phile, here’s the broader intuition:
- Housing becomes singularly correlated to rates during rate shock periods (1Q18, Sep-Nov ’18).
- The impact of rising rates flows through the reported fundamental data on a lag (which is what we continue to see currently in the reported fundamental data, which is reported on (a sometimes significant) lag).
- The collective acknowledgement and acceptance of slowing growth/inflation in the face of persistent reporting of Global and Local Quad 4 data drives rates lower.
- As market rates and policy tightening expectations retreat, housing begins to outperform.
- That outperformance comes following the washout in performance and despite soft (&softening) fundamental data which remains a lagged reflection of the prior move higher in rates
In essence, it’s not more complicated than that … and the procession of dynamics above is why you’ve seen housing outperform over the last 1-2 months in the face of some of the worst fundamental data of the cycle.
None of this is new, of course, as we profiled this exact potentiality back in our 3Q18 themes call with the caveat that you needed to wait on the persistent reporting of Quad 4 data to ultimately drive the washout. It’s been nice to see the script actually play out.
Let’s explore some other prospective more/less ironies shall we…
Labor: More Jobless Government workers = Less Jobless workers, apparently. Jobless Claims printed a 1-handle with 199K in the latest week, marking the lowest level since 1969. In other words, we have the same absolute level of Jobless Claims currently as we did 50 years ago when the labor force was only ~81mn, or ~50% less than it is today. Compensation growth always accelerates as labor market tightness peaks at the end of the cycle, every cycle … when that occurs as growth is slowing, profit margins are at peak and we’re set to comp against peak earnings growth, the profitability outlook is not one that cultivates multiple expansion.
Rates: Are we now in a temporary purgatorial state that puts both the SPX and 10Y yields in a knife fight (see yesterday’s Early Look for how to win a knife fight)?
In other words, is rates rising now the principle catalyst for rates falling? In other, other words, would a hawkish re-pivot in monetary policy trump slowing growth/dovish policy as the lead candidate to drive a next step function lower in long rates as the market capitulates on the forward outlook? Higher rates = lower rates is a sacred irony for curve compression enthusiasts.
Profit Cycle: Despite the markets prolific capacity for discounting, it can’t simply skip to discounting some sanguine future state if the outlook for the foreseeable future remains one of deceleration.
What does that mean?
The profit cycle has crested and just now begun to roll. If it was probable that profit growth was going to re-inflect and accelerate in 2Q/3Q, then one could make a reasonable case for the market “looking past” a soft 1Q.
But that’s not the probable scenario.
The probable scenario is antithetical to that as the NTM sees us comping against earnings growth numbers that were the recipient of the cumulative benefits of the longest stretch of accelerating, harmonized global and domestic growth ever and further juiced by unprecedented late-cycle fiscal stimulus domestically.
That setup is, in a word, uncompable.
But because the profit cycle slowdown is a known known and will be a slow-moving wreck of sorts, we’ll be force fed endless headlines about how it’s invariably and fully ‘priced in’ for the next few months.
Would it be sweet irony if we now pivot bullish as economic consensus catches up to the call we made back in September?
Ohhh, that would be sweet. But the process doesn’t have us there, yet.
Sticking to the process also means not loving and owning every Quad 4/Quad 3 exposure at every price.
To contextualize that within the context of a question everyone loves to ask us: Will we get some version of a rally should larger-scale Chinese stimulus and trade conflict, government shutdown and Brexit resolutions all manifest simultaneously.
Yes, probably – but that’s why we dynamically risk manage our positioning.
But it also doesn’t mean we whimsically abandon the process if it says the slope of the growth line that defines the Trend and our forward outlook remains unchanged.
In effect, it means you simply wait, trade the chop and be more price sensitive …. short/buy those same, preferred Trend exposures when they hit the high/low end of the risk range.
If, however, that positive set of fringe dynamics transpired as growth was set to move from bad to less bad (and on the way to good), you’d see us pivot accordingly and unemotionally.
It’s now end of January and in true in-one-(y)ear-and-out-the-other fashion, most resolutions have already met their terminal end.
For us, our “having more” basket of resolutions can be sufficiently captured by the single, resolute pursuit of innovating and iterating the #Process.
Better #Process … One meta-resolution to rule them all.
In risk management terms, you’ll look better, have more and live longer.
Our immediate-term Global Macro Risk Ranges (with intermediate-term TREND views in brackets) are now:
UST 10yr Yield 2.63-2.80% (bearish)
UST 2yr Yield 2.48-2.62% (bearish)
SPX 2 (bearish)
NASDAQ 6 (bearish)
Utilities (XLU) 52.01-54.20 (bullish)
REITS (VNQ) 76.01-80.18 (bullish)
Industrials (XLI) 65.89-70.22 (bearish)
Housing (ITB) 31.81-33.73 (bullish)
Gold 1 (bullish)
Copper 2.61-2.71 (bearish)
Have a great weekend,
Christian B. Drake
U.S. Macro analyst
