Market History: Here's What Happens to Earnings When The Economy Slows

01/16/19 07:45AM EST

Editor's Note: Below is a brief excerpt and chart from today's Early Look written by CEO Keith McCullough. Click here to learn more about the Early Look.

Market History: Here's What Happens to Earnings When The Economy Slows - Earnings cartoon 11.03.2015

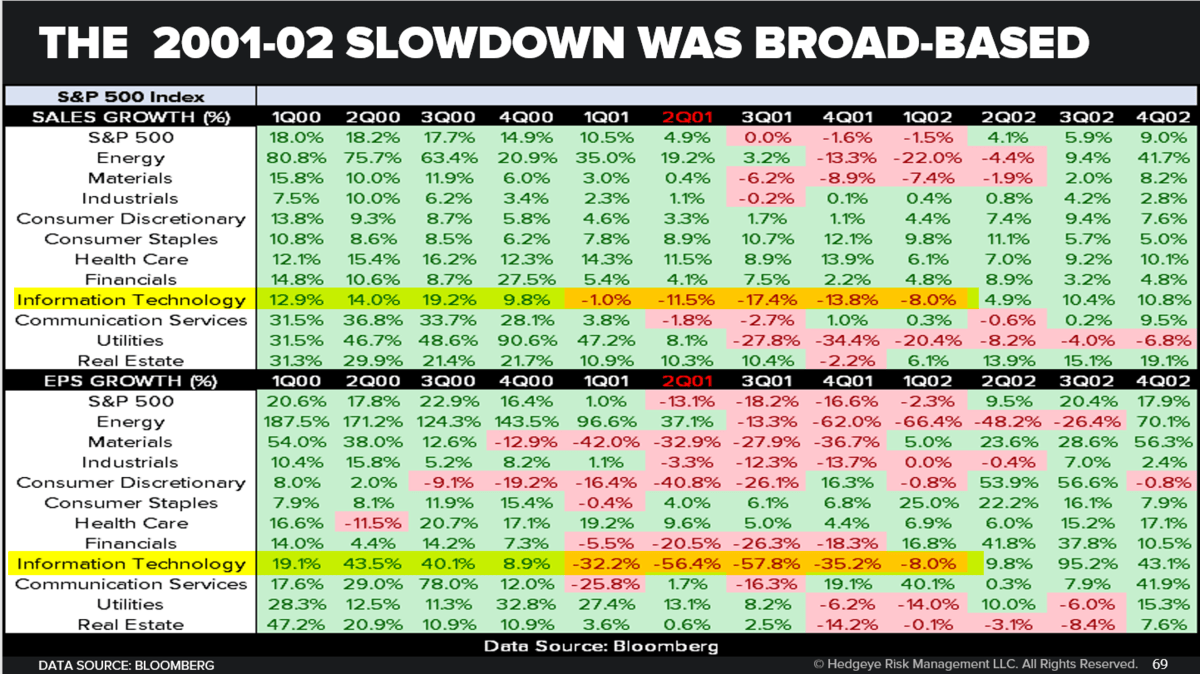
How many expert stock pickers of the FAANG and smid-cap cloud cyclical peak know what happened to what used to be called the cloud (the internet) stocks as The Economic Cycle peaked at +5.3% year-over-year GDP growth in Q2 of 2000?

Here’s a quick historical rewind on both peak GDP vs. “it’s different this time” Tech profits back then:

A) Year-over-year US GDP Growth:

  1. Q2 of 2000 = +5.3%
  2. Q3 of 2000 = +4.1%
  3. Q4 of 2000 = +3.0%
  4. Q1 of 2001 = +2.3%
  5. Q2 of 2001 = +1.1%

*note, from #PeakCycle in Q2 2000, every quarter GDP slowed

B) Year-over-year SP500 Tech Earnings Growth:

  1. Q2 of 2000 = +44%
  2. Q3 of 2000 = +40%
  3. Q4 of 2000 = +9%
  4. Q1 of 2001 = -32%
  5. Q2 of 2001 = -56%

*note, from #PeakCycle what EPS growth did as GDP slowed

Market History: Here's What Happens to Earnings When The Economy Slows - Chart of the Day

Market History: Here's What Happens to Earnings When The Economy Slows - early look

© 2024 Hedgeye Risk Management, LLC. The information contained herein is the property of Hedgeye, which reserves all rights thereto. Redistribution of any part of this information is prohibited without the express written consent of Hedgeye. Hedgeye is not responsible for any errors in or omissions to this information, or for any consequences that may result from the use of this information.