
“It’s my primary message that we should pay attention to cycles.”
-Howard Marks
In his latest book that I’ve been reviewing, Mastering The Market Cycle, Howard Marks actually suggests you “listen to them.” That’s a little too loose for me. I prefer to measure and map them both in economic data and market signaling terms.
Marks goes to on write that “in order to properly position a portfolio for what’s going on in the environment, the investor has to maintain a high level of attention.” (pg 3)
Agreed. But what you’re paying attention to is what differentiates your views of The Cycle. As Picasso taught us, “it’s not what you’re looking at; it’s what you see”, that matters most.

Back to the Global Macro Grind…
What I see this morning is the 4th best Selling Opportunity in the US stock market since September of 2018.
Unfortunately for hedgies that were not able to generate alpha on the short side during Quad 4 in Q4, the Top 3 Selling Opportunities are now yesterday’s news. You could have shorted the SP500 (SPX) closer to 2800 back at the start of December.
“So” why in the world would you take advantage of the 4th Best Short-selling Opportunity and sell SPX at 2593?
- The top-end of the SPX @Hedgeye Risk Range = 2593 (with 7% immediate-term downside to 2370)
- SPY’s Implied Volatility (IVOL) has been smashed to a -35% DISCOUNT to what’s been realized in the last 30 days
- Both US Growth & Inflation continues to slow as SPX remains Bearish @Hedgeye TREND
Oh right, that darn economic cycle data. What’s the USA update there?
- ISM Manufacturing #slowed to 54.1 in DEC from 59.3 in NOV (its lowest level in 2 years)
- ISM Services #slowed to 57.6 in DEC from its #PeakCycle print of 61.6 in SEP of 2018
- ISM Prices #slowed to 57.6 in DEC from its #PeakCycle print of 64.3 in NOV of 2018
That’s right. As The ROC (rate of change) was peaking for the US Consumption cycle in September, the SP500 peaked. Just saying. Because that’s what both the data and market signal said. Whether you paid attention to that was totally up to you.
“But the consumer is doing well.” True, looking in the rear-view mirror AFTER a record 9 straight quarters of US GDP #accelerating to its #PeakCycle prints of Q2 and Q3 of 2018, the rate of change of US Retail Sales and Consumption growth peaked.
Until proven otherwise, it’s also true that our predictive tracking algo for headline US GDP just ticked down to +1.54% for Q4 of 2018 and that Old Wall consensus is at +2.6%. Our nowcast implied Quad 4 in Q4. Theirs implies it was Quad 1!
This is probably why Howard Marks doesn’t believe anyone can forecast the economy. He’s not a client yet and doesn’t use our models. The only time you should use Wall Street’s consensus economic forecasts is to fade them.
Back to the precise measuring and mapping of it all… Darius, where’s Global Growth at?
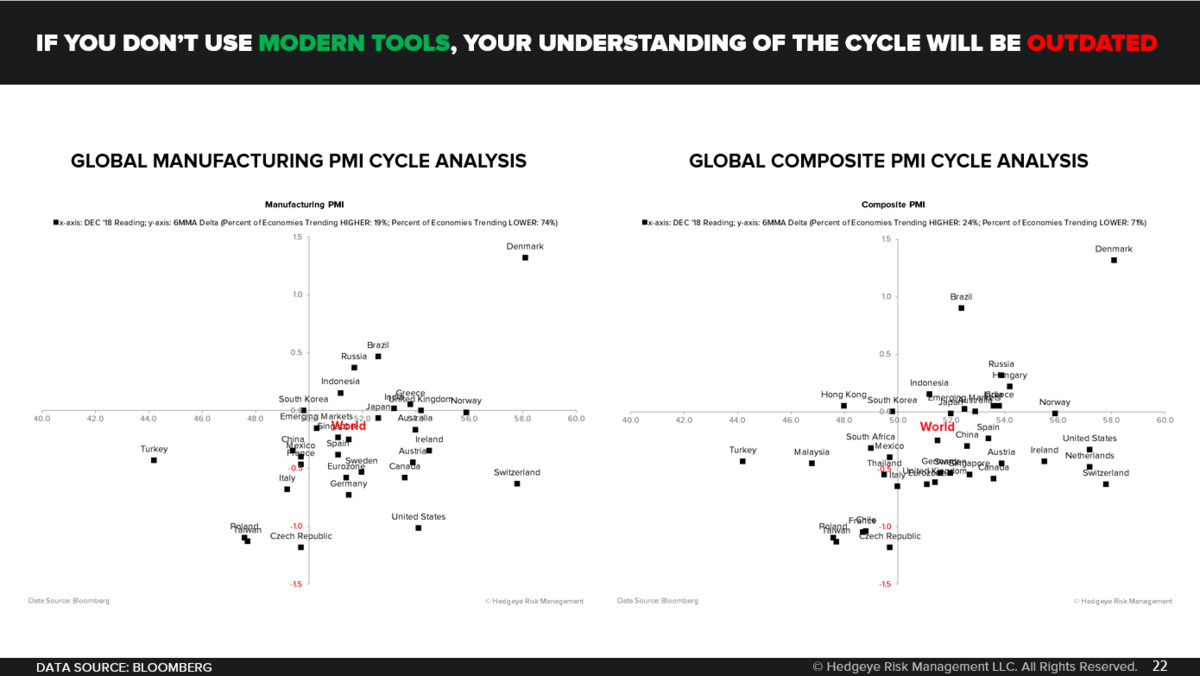
Global Growth Ends 2018 on the Lows: The JPM Global Composite PMI ended 2018 at 52.7 – its lowest level since SEP of 2016, which is not good considering the onslaught of increasingly difficult comparisons for global growth here in the first three quarters of 2019.
The weakness in PMI readings was broad based, both in terms of components and economies. Highlights include:
- Manufacturing: 74% of the 31 economies we track were trending lower as of DEC, unchanged from 74% in NOV
- Accelerated MoM: Indonesia, Italy, Japan, South Korea, UK
- Decelerated MoM: Australia, Brazil, Canada, China, Emerging Markets, Eurozone, France, Germany, India, Spain, Turkey, US, World
- Services: 71% of the 17 economies we track were trending lower as of DEC, up massively from only 53% in NOV
- Accelerated MoM: Brazil, Italy, UK
- Decelerated MoM: Australia, China, Emerging Markets, Eurozone, France, Germany, India, Japan, US, World
- Composite: 71% of the 38 economies we track were trending lower as of DEC, unchanged from 71% in NOV
You can audit these numbers in ROC (rate of change) terms yourself. Rather than “listening” to The Cycle data, we simply use advanced excel, python, and other cool tools of the modern mathematical era.
‘Oh, nice call KM – but how do you know all of this isn’t priced in?’ I don’t; do you?
What I do know is that when the following crashes and draw-downs in major US Equity indexes equated to:
- Russell 2000 crash of -27.2% from the end of AUG 2018 to DEC 24th, 2018
- NASDAQ crash of -23.6% from the end of AUG 2018 to DEC 24th, 2018
- SP500 draw-down of -19.8% from the end of SEP 2018 to DEC 24th, 2018
Those moves were consistent with the stock market draw-downs and crashes we’d already observed in China, EM, and Europe from their respective #PeakCycles back in Q4 of 2017 (Germany) and Q1 of 2018 (China).
“So”… if it’s not the 4th Best Selling Opportunity since SEP of 2018… what is it? The beginning of the next US economic growth #acceleration? How about the next breakout in interest rates and the Financials (XLF)?
Those are fun perma bull narratives, but I’ll stick with the most probable one (Quad 4 in Q1 then Quad 3 in Q2 and Q3). That’ll have me buying the damn dips in Treasuries, Gold, and US Housing when they’re at the low-end of my risk ranges.
Our immediate-term Global Macro Risk Ranges (with intermediate-term TREND views in brackets) are now:
UST 10yr Yield 2.56-2.82% (bearish)
SPX 2 (bearish)
RUT 1 (bearish)
NASDAQ 6 (bearish)
Shanghai Comp 2 (bearish)
VIX 18.01-36.05 (bullish)
USD 95.10-96.75 (neutral)
EUR/USD 1.13-1.15 (bearish)
YEN 107.09-111.17 (bullish)
Gold 1 (bullish)
Best of luck out there today,
KM
Keith R. McCullough
Chief Executive Officer
