Editor's Note: Below is a brief excerpt from today's Early Look written by Director of Research Daryl Jones. Click here to learn more about the Early Look.
|
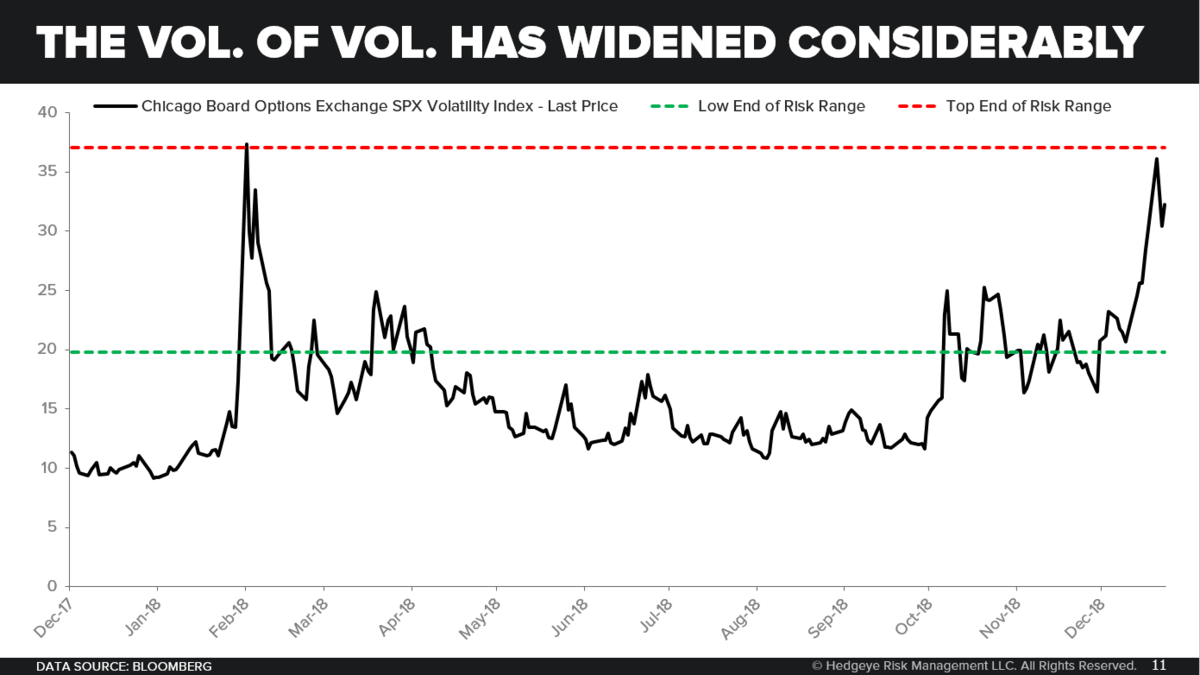
In the Chart of the Day, we’ve actually highlighted volatility as measured by the VIX going back a year. As the chart emphasizes, despite the sell off in the VIX yesterday, at roughly 31 on the VIX we are still at levels we haven’t seen since the shake out in volatility since early February this year. Back then when the VIX spiked, they blamed it on the “machines”. Now of course the blame game also includes the “machines”, but in addition includes Trump, the Democrats, student debt, the deficit, the Fed, the debt market, Steve Mnuchin ... I mean you name it for the blame game as to why the stock market is selling off. Some of you savvy analysts are probably realizing that there is also this sneaky thing called #Quad4 happening. |