Editor's Note: Below is a chart (and excerpt) from today's Early Look written by Hedgeye CEO Keith McCullough.

|
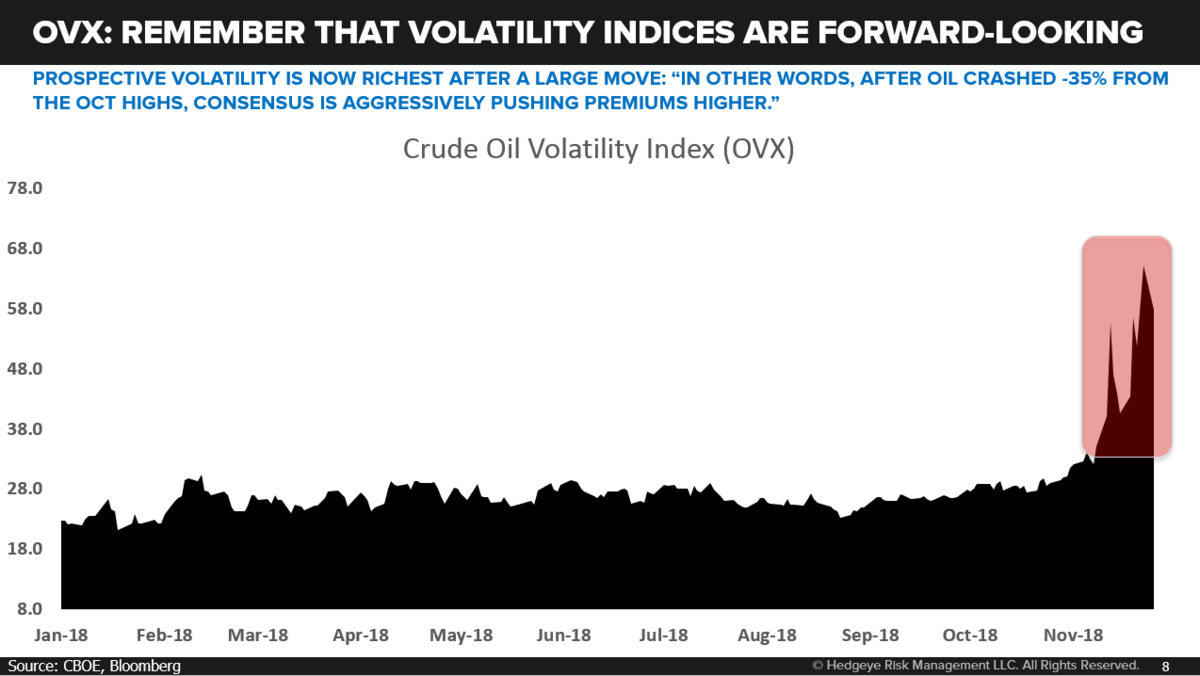
Here’s this morning’s quantified IVOL (implied volatility vs. 30-day realized) look on that:
In other words, AFTER Oil crashed -35% from the OCT highs, consensus is aggressively pushing PREMIUMS higher. Whereas AFTER every bounce in either the US stock market or Tech, consensus gets complacent. Again, this isn’t how the market “feels” … or how I want or need it to be positioned… it’s simply how the market IS positioned vs. where it USED TO BE positioned: A) 1-month ago, TECH (XLK) had an implied volatility PREMIUM of +22% (vs. 30-day realized) |