
Investment Company Institute Mutual Fund Data and ETF Money Flow:
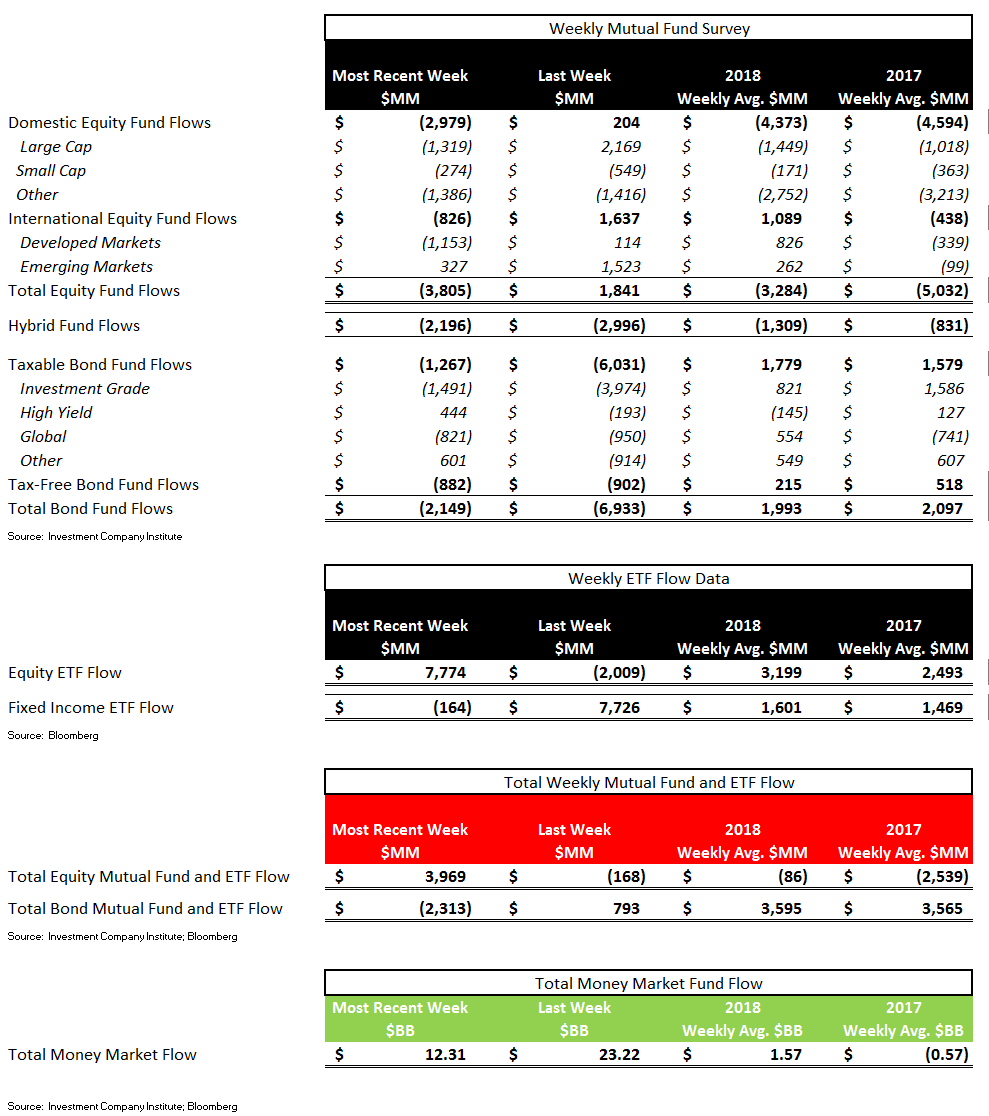
In the most recent 5-day period ending November 14th, total equity mutual funds put up net outflows of -$3.8 billion, trailing the year-to-date weekly average outflow of -$3.3 billion but outpacing the 2017 average outflow of -$5.0 billion.
Fixed income mutual funds put up net outflows of -$2.1 billion, trailing the year-to-date weekly average inflow of +$2.0 billion and the 2017 average inflow of +$2.1 billion.
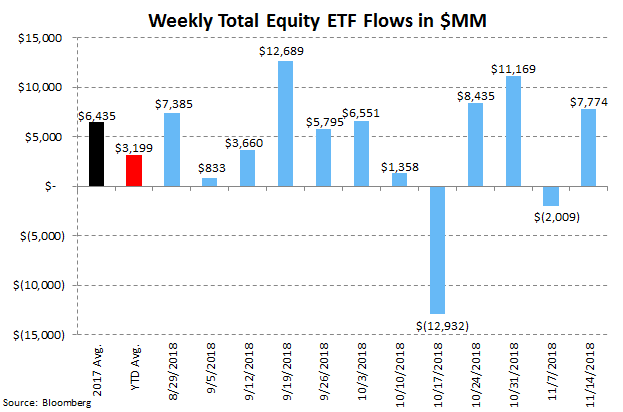
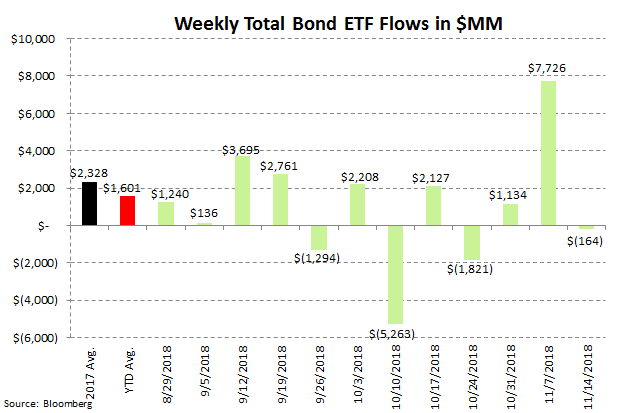
Equity ETFs had net subscriptions of +$7.8 billion, outpacing the year-to-date weekly average inflow of +$3.2 billion and the 2017 average inflow of +$2.5 billion. Fixed income ETFs had net outflows of -$164 million, trailing the year-to-date weekly average inflow of +$1.6 billion and the 2017 average inflow of +$1.5 billion.
Mutual fund flow data is collected weekly from the Investment Company Institute (ICI) and represents a survey of 95% of the investment management industry's mutual fund assets. Mutual fund data largely reflects the actions of retail investors. Exchange traded fund (ETF) information is extracted from Bloomberg and is matched to the same weekly reporting schedule as the ICI mutual fund data. According to industry leader Blackrock (BLK), U.S. ETF participation is 60% institutional investors and 40% retail investors.
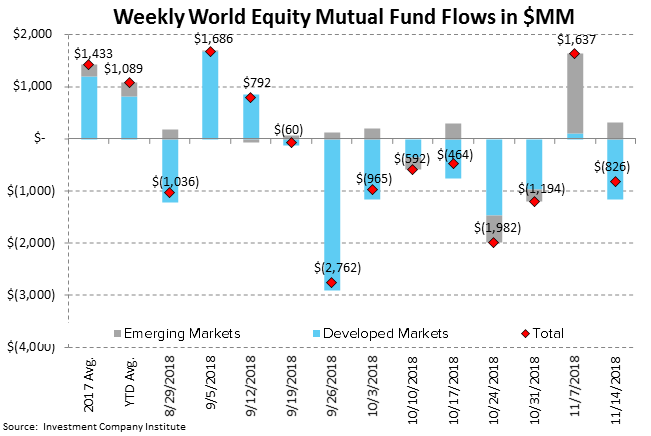
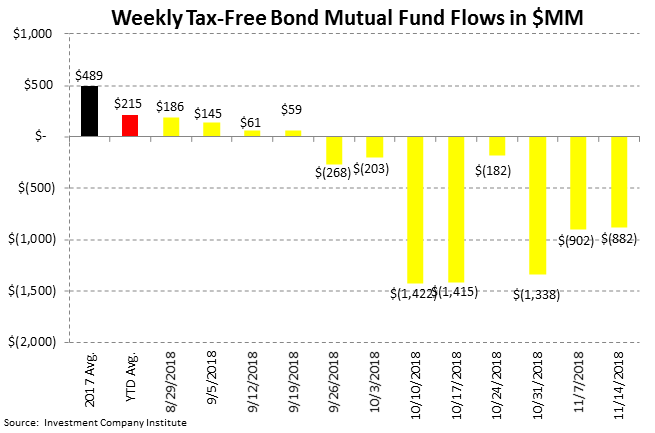
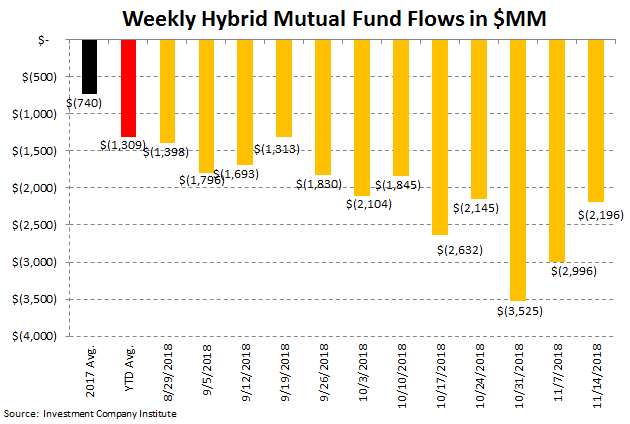
Most Recent 12 Week Flow in Millions by Mutual Fund Product: Chart data is the most recent 12 weeks from the ICI mutual fund survey and includes the weekly average for 2017 and the weekly year-to-date average for 2018:


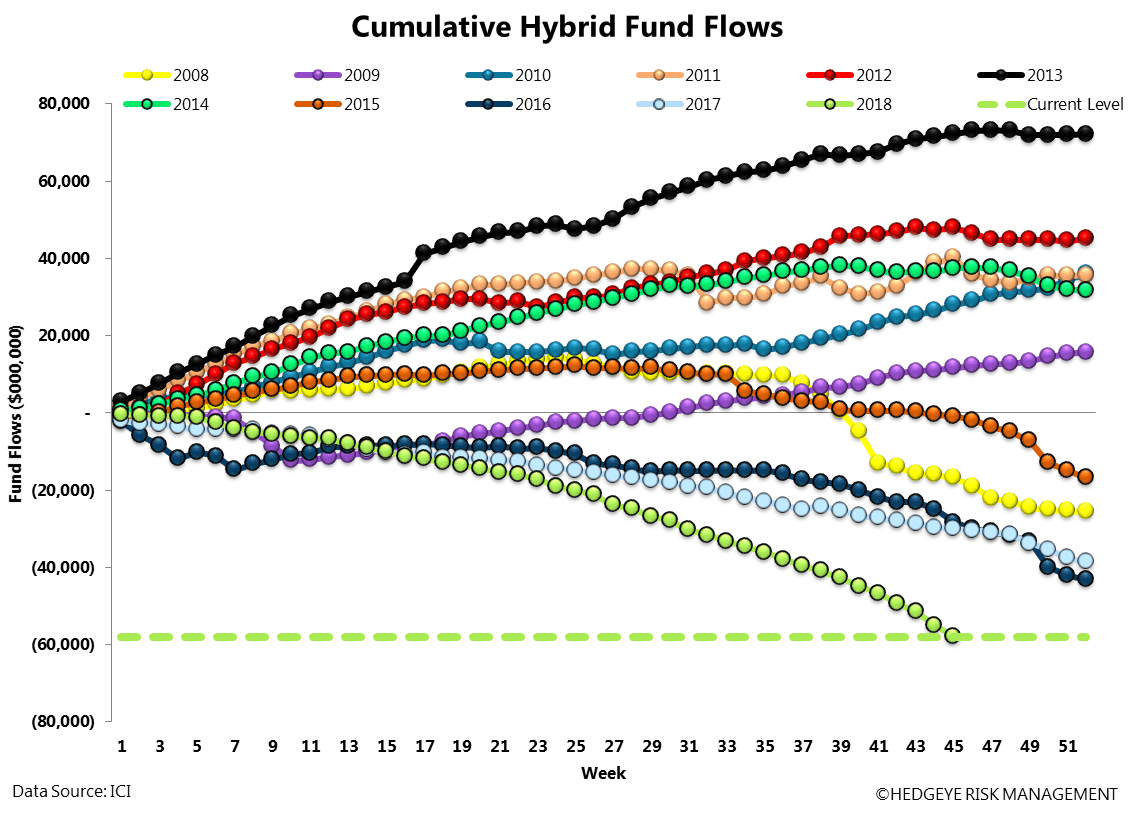
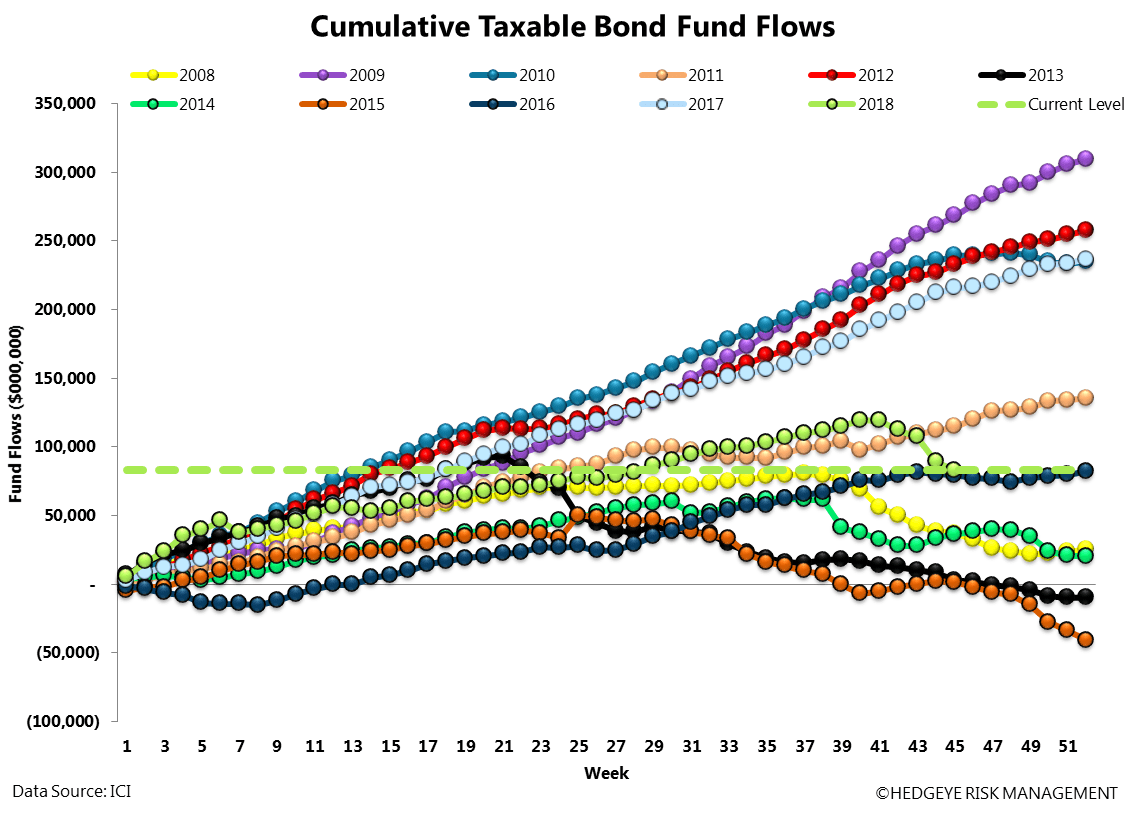
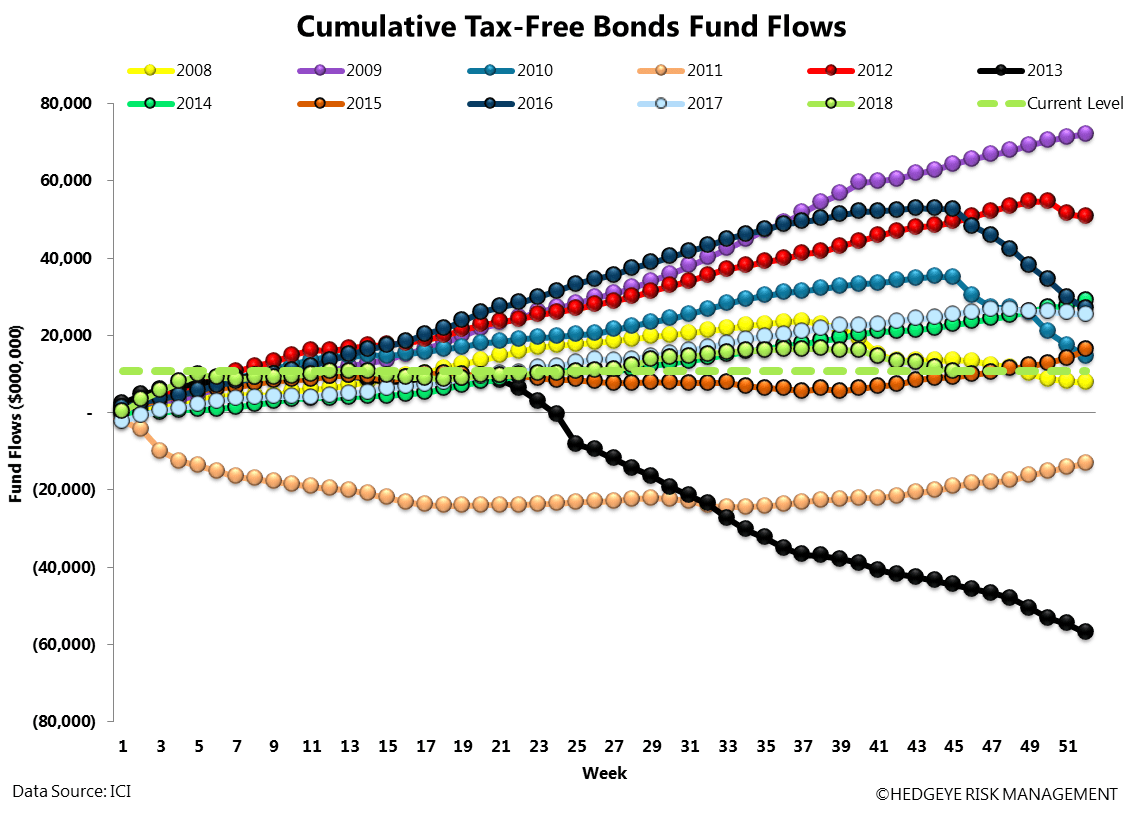
Cumulative Annual Flow in Millions by Mutual Fund Product: Chart data is the cumulative fund flow from the ICI mutual fund survey for each year starting with 2008.


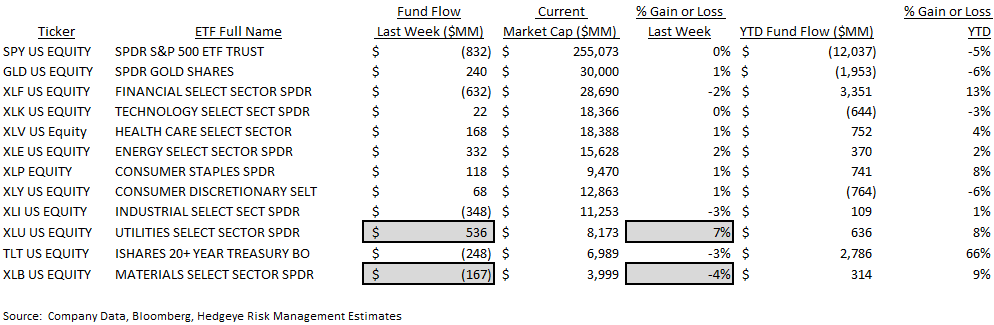
Most Recent 12 Week Flow within Equity and Fixed Income Exchange Traded Funds: Chart data is the most recent 12 weeks from Bloomberg's ETF database (matched to the Wednesday to Wednesday reporting format of the ICI), the weekly average for 2017, and the weekly year-to-date average for 2018. In the third table are the results of the weekly flows into and out of the major market and sector SPDRs:
Sector and Asset Class Weekly ETF and Year-to-Date Results:
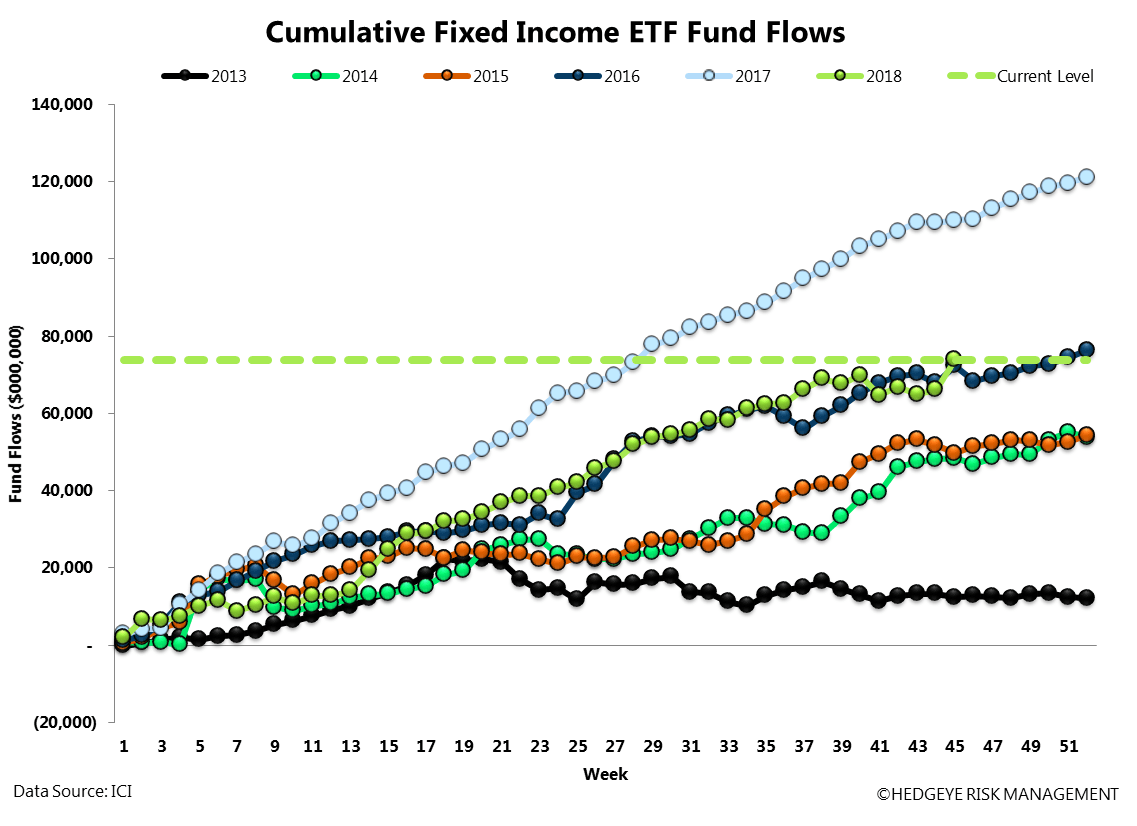
Cumulative Annual Flow in Millions within Equity and Fixed Income Exchange Traded Funds: Chart data is the cumulative fund flow from Bloomberg's ETF database for each year starting with 2013.

Net Results:
The net of total equity mutual fund and ETF flows against total bond mutual fund and ETF flows totaled a positive +$6.3 billion spread for the week (+$4.0 billion of total equity inflow net of the -$2.3 billion outflow from fixed income; positive numbers imply greater money flow to stocks while negative numbers imply greater money flow to bonds. The 52-week moving average is -$3.3 billion with a 52-week high of +$24.2 billion and a 52-week low of -$41.3 billion

Exposures: The weekly data herein is important for the public asset managers with trends in mutual funds and ETFs impacting the companies with the following estimated revenue impact:
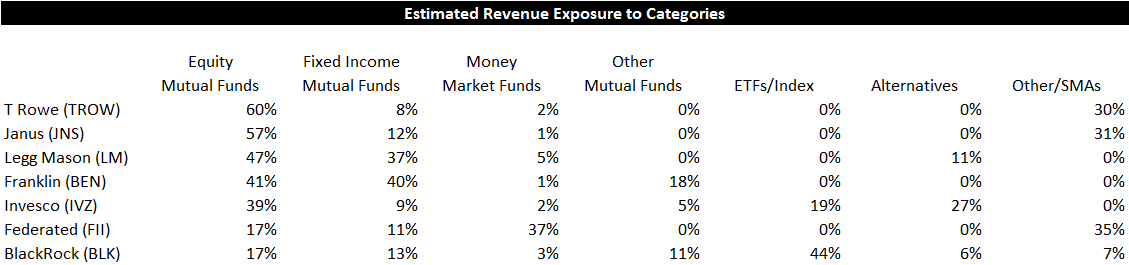
Joshua Steiner, CFA
