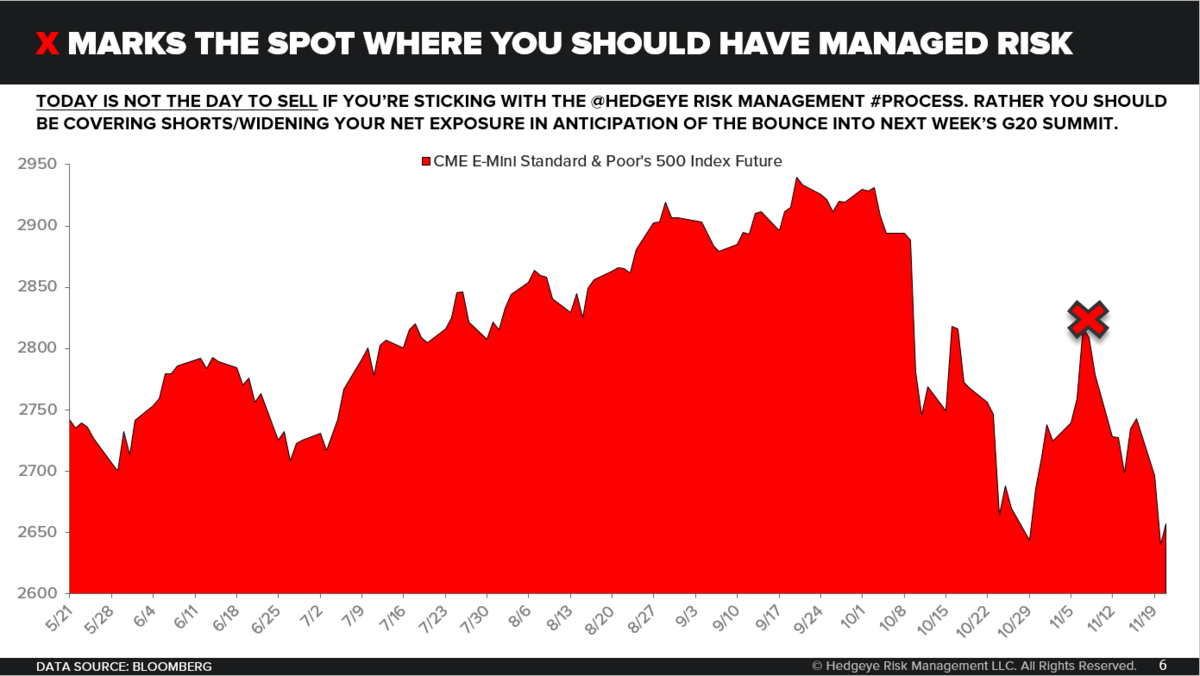
Editor's Note: Below is a chart (and excerpt) from today's Early Look written by Hedgeye CEO Keith McCullough.
|
Making calls at major market turns obviously isn’t easy. I’m genuinely grateful to my God for giving my team both the independence of mind and diligent process to have had the confidence to make the Quad 4 in Q4 call when we made it... Q: What are the odds of something that’s down -15% being down -18-22% in the coming months if the 3 causal factors driving the draw-downs towards crashes (GROWTH, INFLATION, and PROFITS #slowing) don’t change? Q: What are the odds of coming back from down -22% (where you have to be up +28% from there) back to break-even? Therefore, on market corrections (i.e. they haven’t been dips), the best strategy to improve your portfolio’s position is to add to what we call Bullish @Hedgeye TRENDs while covering-some short exposure in Bearish @Hedgeye TRENDs when they’re oversold. |