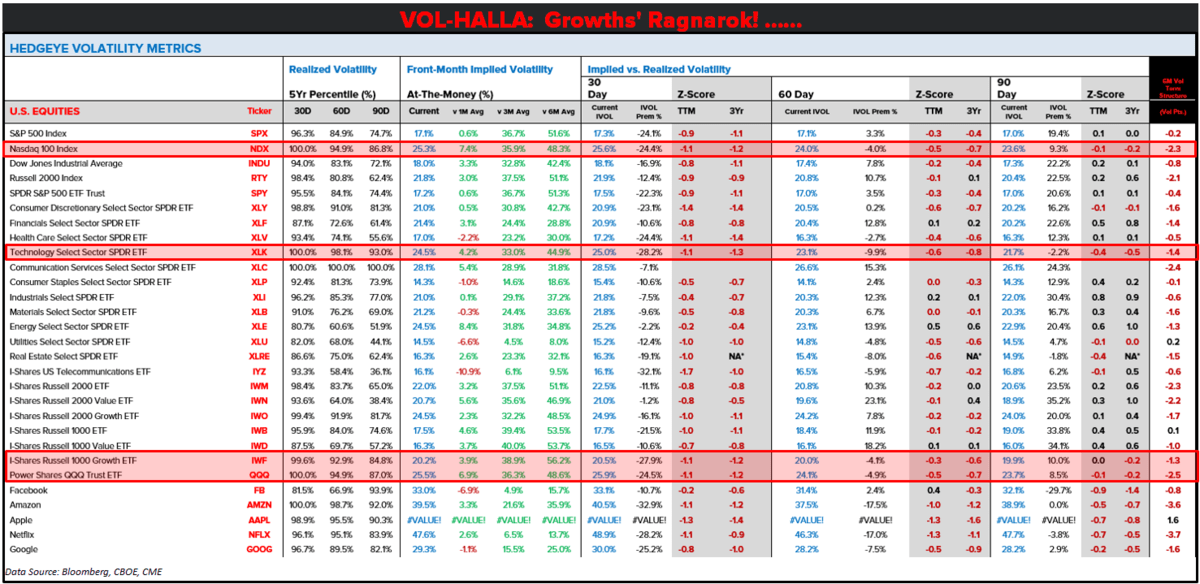
Editor's Note: Below is a chart (and excerpt) from today's Early Look written by Hedgeye U.S. Macro Analyst Christian Drake.

|
It’s been a series of lower lows over the past year and suffice it to say, with slowing top-line growth, worsening margins and disappointing guidance characterizing the latest quarter, our view and outlook remains unchanged. And from a top-down perspective, a trending breakout in volatility is not the bullish cultivator of unprofitable, story stocks. It needn’t represent portfolio Ragnarok though either. Vol represents the expectation for price movement and moving prices represent opportunities, provided you are on the right side of them. The halls of Vol-halla remain open to the data-dependent souls who measure, map, and proactively risk-manage 2nd derivative inflections. |