CHART OF THE DAY: Implied Volatility Discounts (And Factual Realities)

11/09/18 09:46AM EST

Editor's Note: Below is a chart (and excerpt) from today's Early Look written by Hedgeye Macro Analyst Ben Ryan.

CHART OF THE DAY: Implied Volatility Discounts (And Factual Realities) - zaa

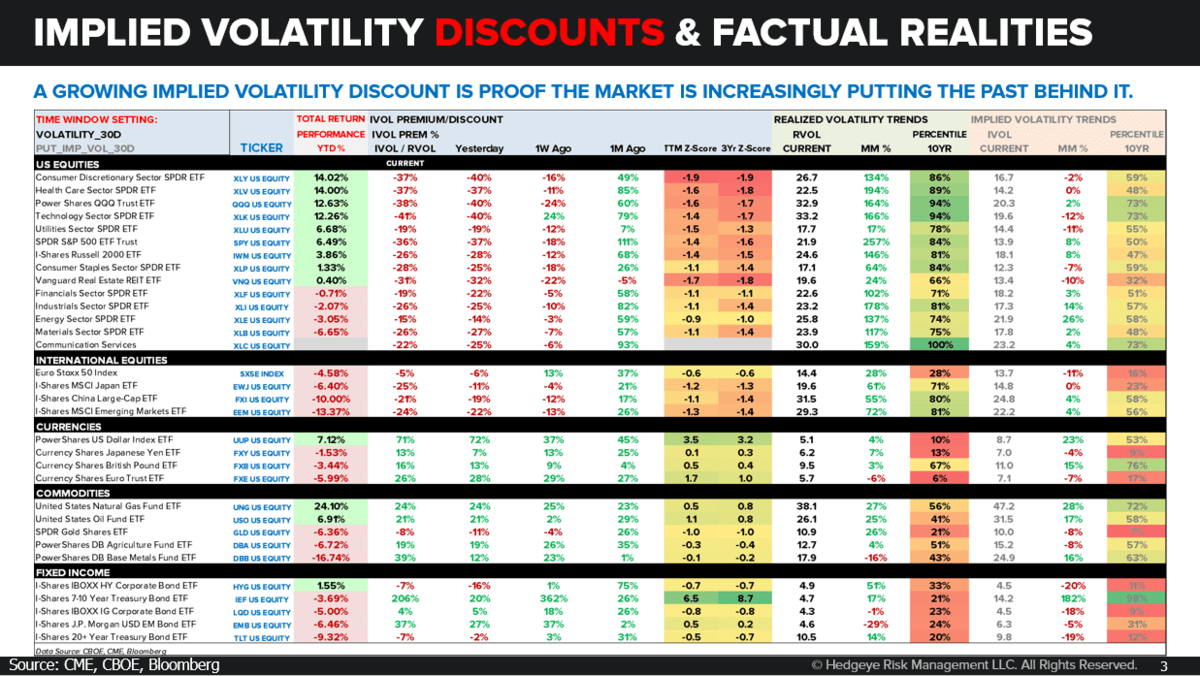
That point is emphasized because it’s exactly what we’ve seen the last two weeks after a very rare environment from a hedging cost and volatility surface perspective. As we show in the Chart of the Day, the U.S. equity market vehicles that:

  1. Corrected the most in October
  2. Were most volatile in October (see percentile readings on the far right side of the chart)
  3. And have bounced the most from the lows
  4. Have the deepest Implied Volatility DISCOUNTS

Here’s What We Know For Sure about the future vs. past comparison gleaned from the widening implied volatility DISCOUNTS:

A growing “implied volatility DISCOUNT” is rate-of-change proof that the market is increasingly putting October’s volatility environment in the rearview.

CHART OF THE DAY: Implied Volatility Discounts (And Factual Realities) - 11.09.18 EL Chart

CHART OF THE DAY: Implied Volatility Discounts (And Factual Realities) - early look

© 2024 Hedgeye Risk Management, LLC. The information contained herein is the property of Hedgeye, which reserves all rights thereto. Redistribution of any part of this information is prohibited without the express written consent of Hedgeye. Hedgeye is not responsible for any errors in or omissions to this information, or for any consequences that may result from the use of this information.