CHART OF THE DAY: Bond Yields (Did You Chase YTD Highs?)

10/29/18 08:01AM EDT

Editor's Note: Below is a chart (and excerpt) from today's Early Look written by CEO Keith McCullough.

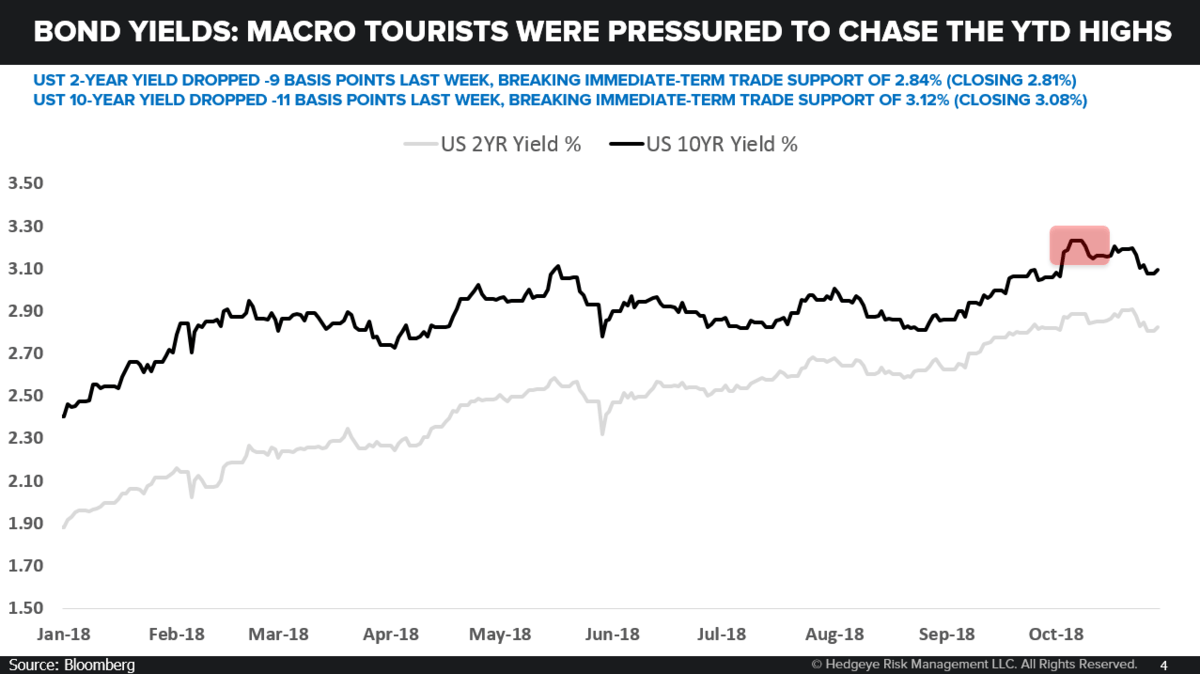
Being short Momentum, High Beta, and US Growth sounded “creative” and “interesting” at the time that we made that call at the end of September. Now it just sounds right. 

The other thing that worked out well for us last week (instead of freaking out and capitulating alongside consensus at 3.23% on the UST 10yr Yield earlier in the month), was being long both short and long-term US Treasury Bonds: 

A) UST 2-year Yield dropped -9 basis points last week, breaking immediate-term TRADE support of 2.84% (closing 2.81%)
B) UST 10-year Yield dropped -11 basis points last week, breaking immediate-term TRADE support of 3.12% (closing 3.08%) 

CHART OF THE DAY: Bond Yields (Did You Chase YTD Highs?) - 10.29.18 EL Chart

CHART OF THE DAY: Bond Yields (Did You Chase YTD Highs?) - early look

© 2024 Hedgeye Risk Management, LLC. The information contained herein is the property of Hedgeye, which reserves all rights thereto. Redistribution of any part of this information is prohibited without the express written consent of Hedgeye. Hedgeye is not responsible for any errors in or omissions to this information, or for any consequences that may result from the use of this information.