Editor's Note: Below is a brief excerpt and chart from today's Early Look written by Hedgeye CEO Keith McCullough. Click here to learn more.
|
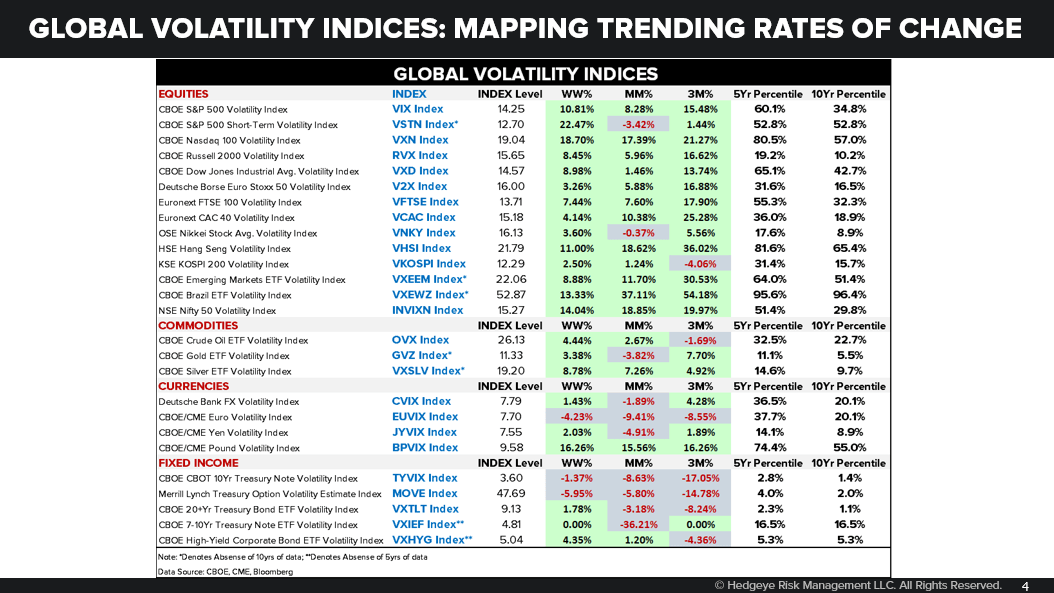
It’s one thing for volatility to cluster, episodically, then fade. It’s entirely another for a breakout in volatility to start to trend. We define @Hedgeye TRENDs as 3 months or more in terms of duration. As you can see in today’s Chart of The Day below from our full-time Volatility Analyst, Ben Ryan, what we have currently in Global Macro markets is a Trending Breakout In Volatility. For many US centric equity investors this is new. If you invest globally, far from it. As you can see in the table of volatility data:
As you move down the table you’ll obviously make your own observations but... |