Are you prepared for U.S. #GrowthSlowing?
That’s our call. We’re forecasting a U.S. economic slowdown in the back half of 2018. It’s time to proactively prepare your portfolio or remain extremely vulnerable.
In case you missed it, below is a key excerpt transcribed from the recent webcast we hosted with commentary by Hedgeye CEO Keith McCullough. Also below is the video replay.
* * * * *
McCullough: This is the most important thing you need to understand. Rate of change dominates returns.
The U.S. economy has been accelerating for 8 quarters in a row. If this sounds like an amazing streak, it is. You don’t need to be political about it. This has never happened before. The prior record was coming out of the 1991 recession, and that was 7 quarters in a row. You don’t have to characterize it any other way.
Rate of change data does not lie. People do. Always remember that.
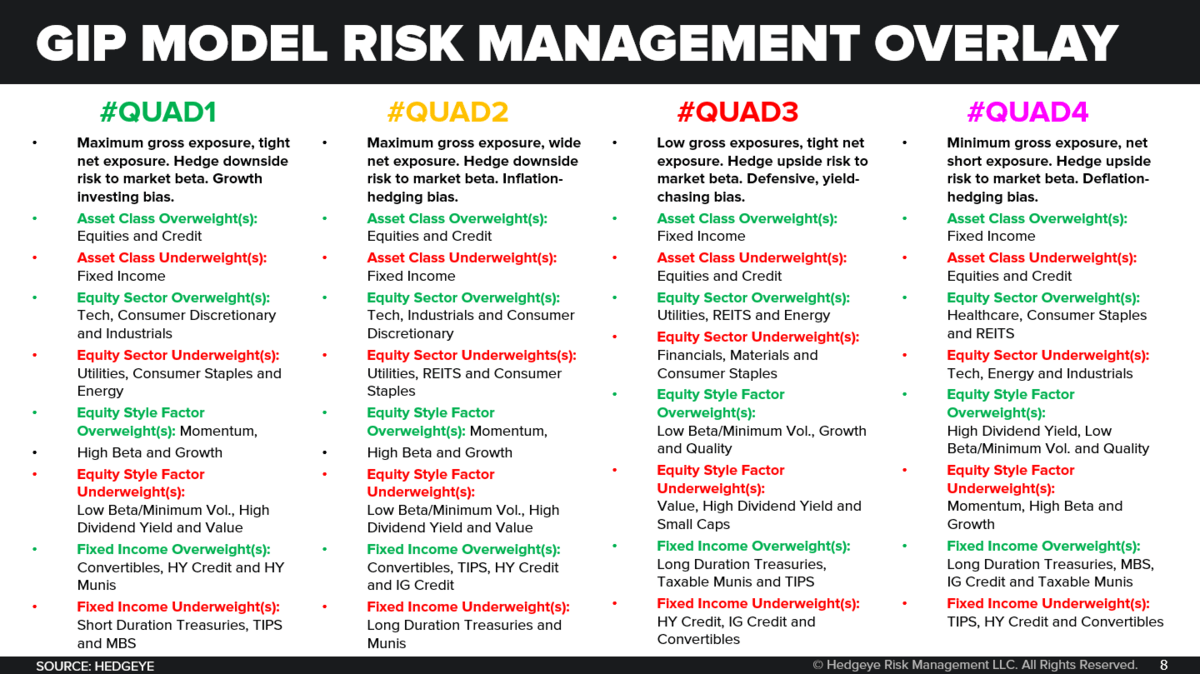
So to review the process, the 4th Quadrant in our model is the death knell. That’s when you have both growth and inflation slowing at the same time. That’s where we think we’re going to be by Q4 2018 after being in Quad 1 (Growth accelerating, Inflation slowing) or Quad 2 (Growth and Inflation accelerating) for eight quarters in a row.
Quad 3 is stagflation. That’s what central bankers try to perpetuate once they realize they’re in the Quad 4 death knell. They try to devalue the currency and create asset price inflation.
Sound familiar? That’s exactly what the Chinese did this year when they moved into Quad 4. They devalued the yuan by -4% and tried to create the illusion of growth. But what do the Chinese get? Economic stagflation.

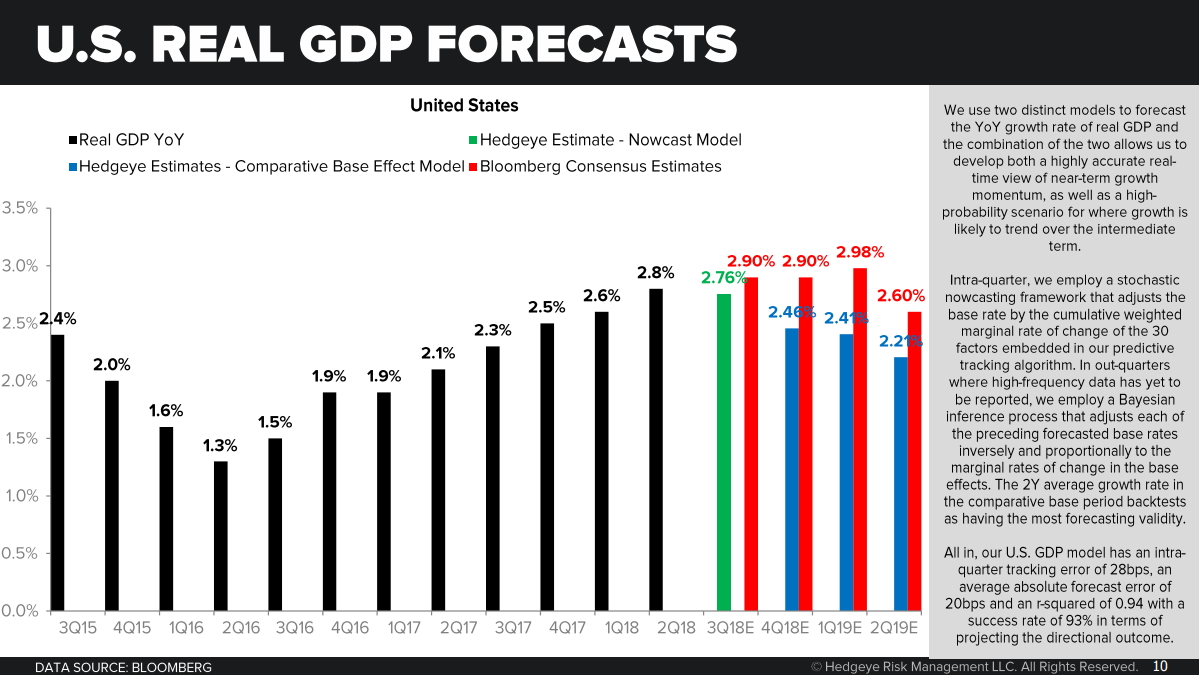
McCullough: Here’s our forecast. This is the model. You go through the process of building a two year base effect model. As we’ll point out further on in this presentation, 75% of the time the forward outlook reflects the inverse of the 2-year base effect. In other words, as the base effects get particularly steep on U.S. #GrowthAccelerating, expect a slowdown. That’s why we think, what we think, because market history does.
So U.S. growth has accelerated for eight straight quarters in a row. Now, see the 1.3% there in 2Q 2016, then the 1.5%, then 1.9% and all the way up to 2.8% in 2Q 2018? That’s 8 quarters in a row of the black line going up.
What that imputes to was a 4.1% quarter-over-quarter SAAR number. That’s the headline number that the media, politicians and Old Wall economists anchor on. Now, the White House calls this number ‘sustainable.’ That’s just a word, it’s not an outlook that’s based on math.
Treasury Secretary Steve Mnuchin said recently, “We can only, at best, forecast GDP 2 years out.” Dude, you don’t have a daily forecast. You don’t have a predictive tracking algorithm. He doesn’t have a track record of predicting GDP like we do.
By the way, the intra-quarter tracking error on our GDP predictive tracking algorithm is 20 basis points. The Atlanta Fed, for its part, has a GDP Nowcast with 240 basis points of intra-quarter tracking error. It’s very hard to get worse at your job than that. All of these people have opinions. That doesn’t mean they’re accurate or you should listen to them.
After having had a U.S. GDP forecast above Wall Street’s going all the way back to the 2H of 2016, our GDP predictive tracking algorithm’s forecast is now below consensus for the next 2 quarters at +2.45% for 3Q 2018 and +1.10% for 4Q 2018, respectively (as measured on a quarter-over-quarter basis… which imputes to year-over-year rates of 2.76% in 3Q 2018 and 2.46% in 4Q 2018).
McCullough: Now, here’s what you do with our Quad playbook. I’d submit this process over anything else as to the causal factors that drive markets from a top-down perspective.
So, as you can see when you go from the first or the second quadrant if you’re looking at U.S. stocks, the two sectors that we’ve liked the most for two years in a row were Consumer Discretionary (XLY) and Technology (XLK) stocks. It was very consistent. If you were a subscriber, you heard this every single day for two years. We said to buy every dip and didn’t apologize for it. Expensive stocks got more expensive because the causal factors were accelerating for 8 quarters in a row.
Now, as you can see, in Quad 4 you get rid of all those exposures. From here to Quad 4, you’ve got about 3 months to rotate.
Remember last week? It wasn’t long ago now that everything went down when the market sold off.
Last week, Facebook sold off after guiding to falling revenue growth and rising expenses. That certainly felt like Quad 4. It wasn’t just Facebook, everything was sold indiscriminately. Google was down and momentum, as a style factor, was down huge.
So clearly, the market is already rotating. And when the market signal tells me the roadmap has fundamentally changed, that’s when we pivot.
For years now, many people have been shorting the market on “expensive” valuation. Or buying the dip in gold all year and losing you money. Growth and inflation are the causal factors. Remember that.