Editor's Note: Below is a brief excerpt from a research note published exclusively for Hedgeye Risk Manager subscribers (with analysis from U.S. Macro analyst Christian Drake). Click here to learn more about Hedgeye Risk Manager.

|
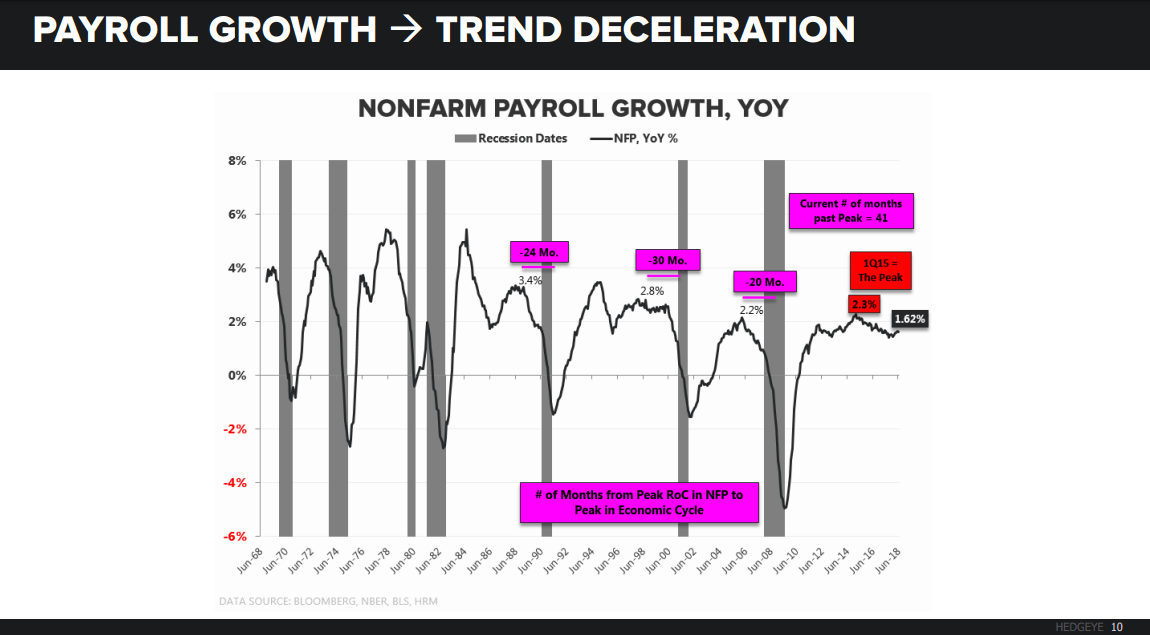
Christian Drake: Next up, jobs. We didn’t get the proprietary Trump jobs indicator from last month. Remember, he knows that we know that he already knew what the numbers were, so he tweeted that out an hour before the release last month. But we did get another Goldilocks jobs report. You can see strong Headline Nonfarm Payroll growth. We printed 213,000 on the headline. That’s versus estimates of 195,000. We also got a net positive revision to the prior three months, up 37,000 jobs. On a year-over-year basis, and I guess this is the larger point, payroll growth slowed marginally to 1.62% year-over-year. Recall, we needed something on the order of 240,000 to 245,000 new jobs to avoid degradation on a year-over-year basis. What you can also see in the chart is an anomalous period in the four months prior to this June release. You saw four months of accelerating payroll growth, again somewhat anomalous at this point in the cycle. With the June report, we returned to deceleration. And you can expect this trending deceleration to continue. We had a favorable comp dynamic in the previous four months. That reverses here. |