Editor's Note: Below is a brief excerpt transcribed from a recent edition of The Macro Show hosted by Macro analyst and Volatility guru Ben Ryan.

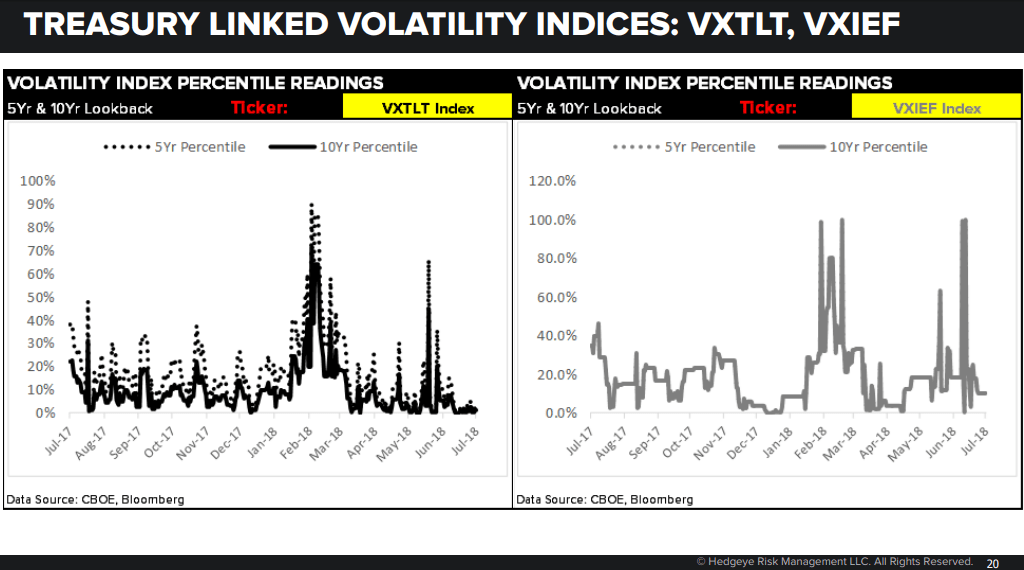
Ben Ryan: On interest rate volatility, you saw volatility pick up in mid-May during the big spike in Treasury rates. What you see now is that volatility has picked up in other sectors but Treasury volatility has absolutely collapsed.
Let’s look at an important representation of that. TLT is the 20+ duration Treasury ETF. VXTLT is the volatility on TLT reconstructed from options markets. Now, you can see the big spikes in volatility mid-May but it’s been absolutely smashed recently. What you see in this chart is that Treasury volatility is at all-time lows.
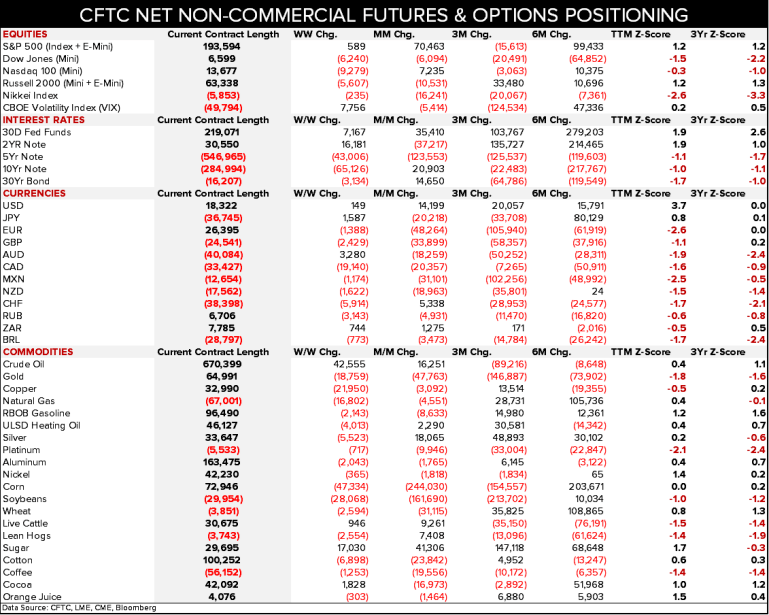
Ryan: But there’s still big short position in the 5-year, 10-year and 30-year that could be washed out. Short the bonds is a bet on higher rates.
You’re talking about -547,000 net short contracts in the 5-year which is absolutely huge.
Sign up for The Macro Show to understand the investing implications.
