Editor's Note: Below is an excerpt from today's Early Look written by Hedgeye Director fo Research Daryl Jones. Click here to get it.
|
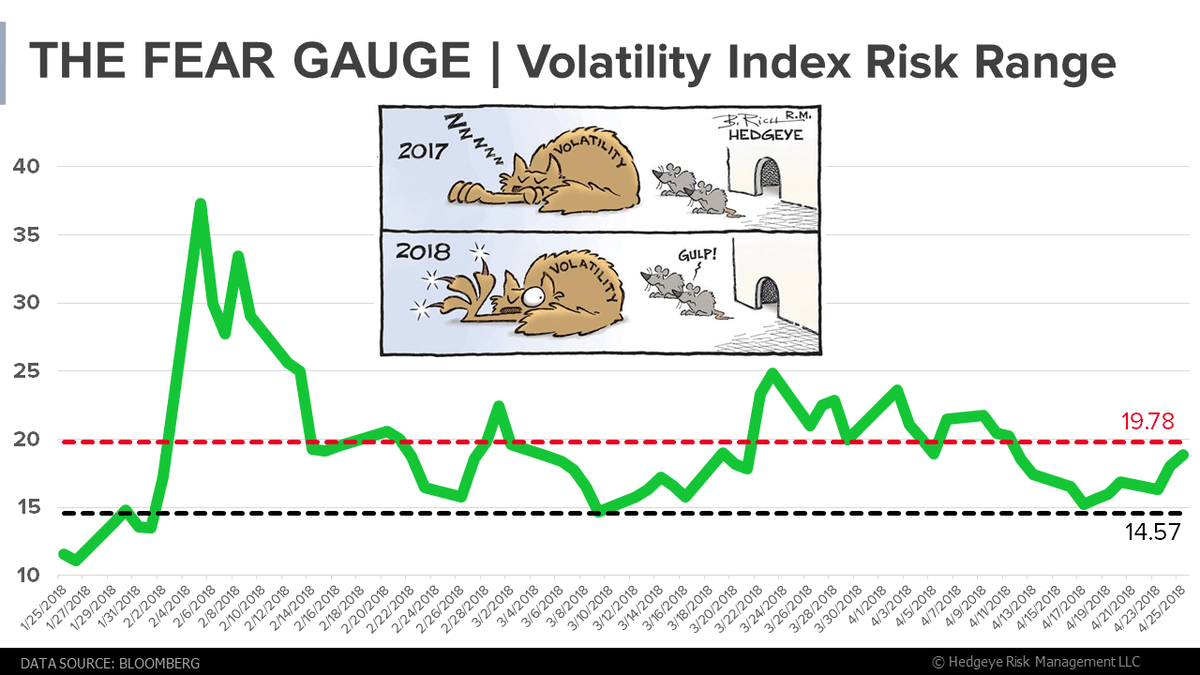
Meanwhile, the VIX has spiked back above 18.00 and the VIX futures curve is once again in backwardation. The implication, of course, is that there is an expectation for more volatility in the short run. For those that don’t know, the VIX takes as inputs the market prices of the call and put options on the S&P 500 for the “front month” and “second month” expirations and is the volatility of a variance swap calculated in percentage terms. As such, it represents the expected range of movement in the S&P 500 over the next year, at 68% confidence level (one standard deviation). So, despite its moniker as the Fear Gauge, the VIX actually implies wider expected returns in BOTH directions. |