Editor's Note: Below is an excerpt from today's Early Look written by Hedgeye CEO Keith McCullough. Click here to learn more about the Early Look.

After rolling over from late JAN to early APR, the most important move in macro last week was a re-acceleration in both inflation expectations and the market signals that perpetuate them:
- US DOLLAR – down -0.3% on the week was enough to drive that inverse correlation that matters most to commodity reflation
- OIL – up a big +8.6% on the week to +11.8% YTD and fresh 2018 highs (that really matters as monthly inflation comparison’s ease)
If you dive into the Sector Styles of the SP500, our re-acceleration in inflation call for Q2 (i.e. Quad 2) was poignant:
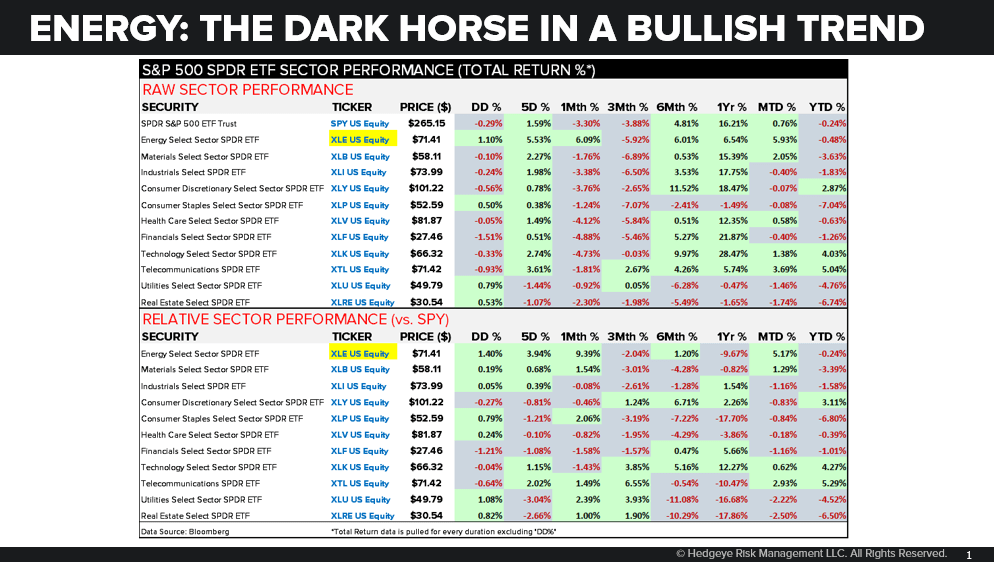
- Energy Stocks (XLE) led the charge +6.0% on the week moving back to Bullish TREND @Hedgeye (from Bearish)
Since getting long either Energy or REITS are contrarian pivots I’ve been considering post Reflation’s Rollover playing out (and it’s really an either/or decision as I don’t think one can really work alongside the other), for now I’ll take Energy (XLE) on pullbacks.