Editor's Note: Below is a brief excerpt from Market Edges, our weekly newsletter contextualizing big picture market trends. Click here to get exclusive savings on Market Edges.

1. Final Update on 4Q 2017 GDP
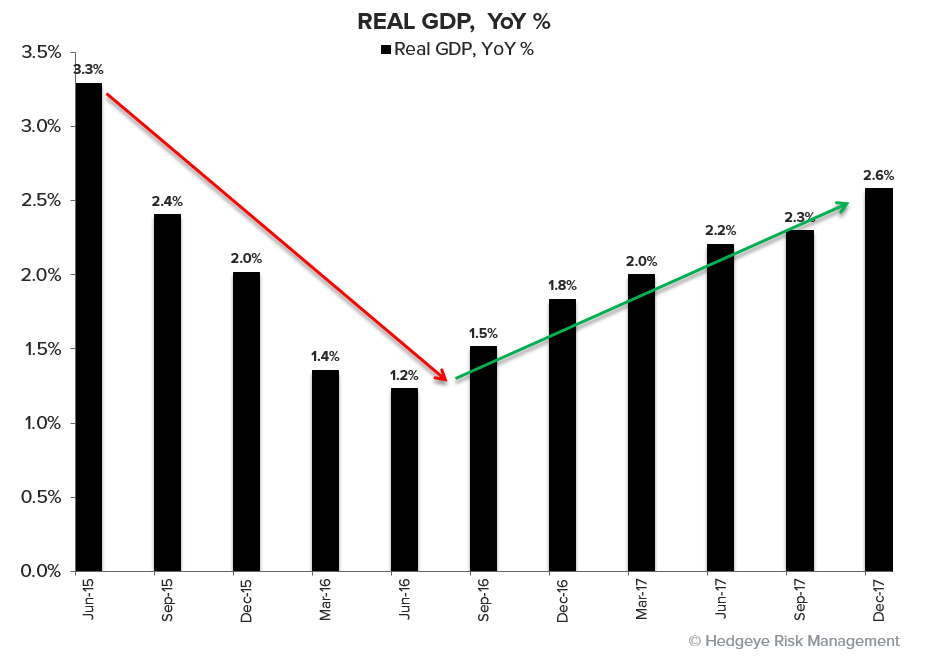
The 4Q 2017 final U.S. GDP estimate got a sizeable positive +40bps revision to the headline with consumption and investment providing the upside:
- Headline GDP was revised +40bps to +2.9% Q/Q SAAR (the third consecutive quarter of GDP near 3%)
- Year-over-year GDP was revised +10bps to +2.6%
- Personal Consumption growth was revised higher by 20bps to 4.0% QoQ SAAR, with a +17 basis point increase (from a contribution perspective) from Services & Non-Durables
- Most of the positive Investment juice came from the inventory side (contribution revised +17bps) while Resi investment was revised marginally lower and NonResi marginally higher
- GDP Deflator and Core PCE Deflator were unchanged at 2.3% and 1.9%, respectfully
So, the 6 straight quarters of conspicuous acceleration in growth gets its final confirmation. The positive revision, of course, now become the (harder) comp.
2. Consumer Confidence: Was This the Peak
US Consumer Confidence is down -3.1 points from the cycle high of 130.8 in February (which came on the heels of the stock market’s epic all-time highs in January) to 127.7 in March.
Was February the peak? We think that was the peak for both Global Growth & Inflation Expectations (positioning). We’re data dependent on calling the US cycle, so this is more of a question than an answer.
Most charts like this were big time tailwinds to our bullish view on both the US economy and its stock market through January 2018.

3. Style Factor Performance = Reflation's Rollover
This is interesting. The top performing "style factors" over the past 3 months, 6 months and year-to-date are precisely the opposite of what's been outperforming over the past week and month. Let's just take one example. As you can see in the chart below, "Low Beta" stocks are starting to outperform "High Beta" stocks.
That has a lot to do with our call on Reflation's Rollover. Low Beta stocks like Utilities perform well in a falling interest rate environment. Utilities stocks are up 3% over the past month versus -2.7% for the S&P 500. All other sectors but, no surprise here either, Energy (XLE) are negative in the past month.

