We disseminate a note several mornings a week with 3 bulleted takeaways from derivatives-centric markets. The point is to hash out observed consensus views with our own to 1) Find asymmetric pressure points and 2) Generate non-consensus ideas. Below is this morning's note to complement Keith's commentary in his top 3 bullets from earlier this morning:
“US SECTORS – our fav S&P Sectors (which are making me nervous at these levels btw) remain Tech and Consumer Discretionary – Tech (XLK) led the intraday rally yesterday, closing up another +0.6% to +7.7% YTD; that’s a great return to be booking, especially vs. our least fav Sector (Utilities) which was down another -0.8% yesterday to -7.2% YTD (that’s a +1490 basis point spread!)”
----------
Performance Gaps (Tech vs. Yield & Energy) – The Information Technology Sector (XLK) widened the relative YTD return gap yesterday to lead S&P 500 sectors at +55bps RAW on the day…
Relative YTD Total Returns vs. SPY (in bps):
XLK: +552
XLY: +346
XLF: +136
XLRE: -953
XLU: -939
XLE: -923
XLP: -772
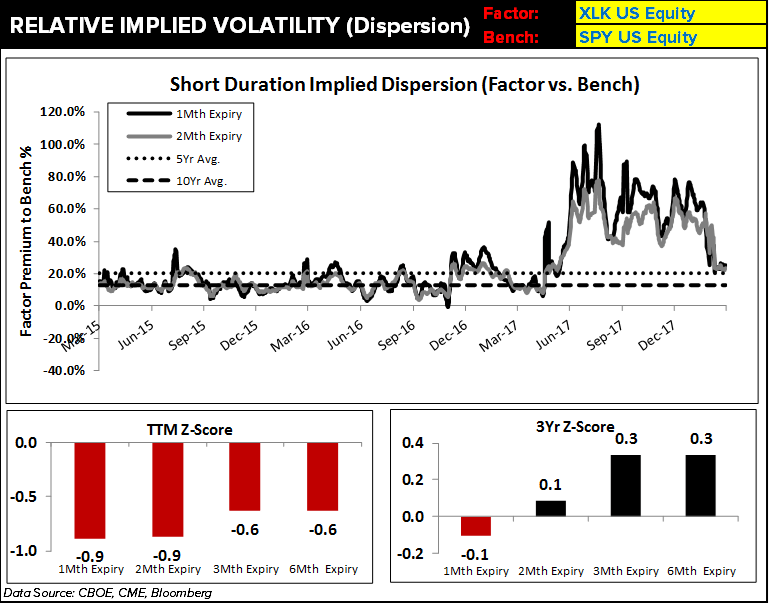
With this start to the year, implied dispersion in the information technology sector has finally reverted closer to 5yr and 10yr averages across the term structure. Remember that last year we had one eye always on sector volatility markets to help us track FAANG fears and volatility pricing in the tech sector. Those consensus positions were beaten to a pulp on every pullback to higher lows.
On the current set-up, let’s look at a 2Mth contract expiry. Below we show figures for current vs. average dispersion. In the second visual we show this XLK vs. SPY implied dispersion graphically in time series form.
We represent this as the % premium of XLK IVOL vs. SPY IVOL on the same duration, in this case a 2mth contract expiry:
Current 2Mth expiry Premium %: +24%
5Yr Average 2Mth expiry Premium %: +20%
10Yr Average 2Mth expiry Premium%: +13%
Note that we’re calling out mean reversion in implied sector dispersion after vol buyers have been strangled for a year (We’re by no means saying consensus is stretched on the bull-side of tech, but the set-up has become more bullish/less bearish on the margin recently.

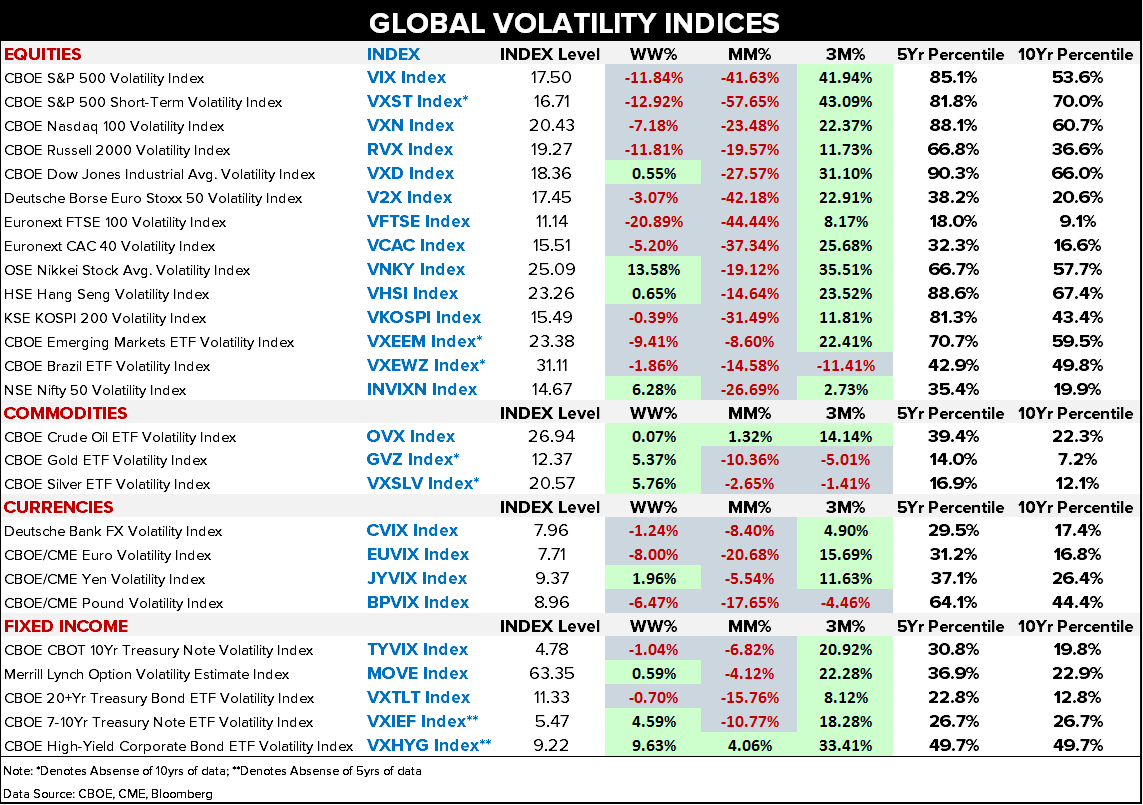
Global Volatility Compression – A month removed from the Feb lows, and every volatility index on our Index Monitor is lower m/m with the exception of two:
High-Yield Credit (VXHYG): +4.1% m/m
Crude Oil (OVX): +1.3%
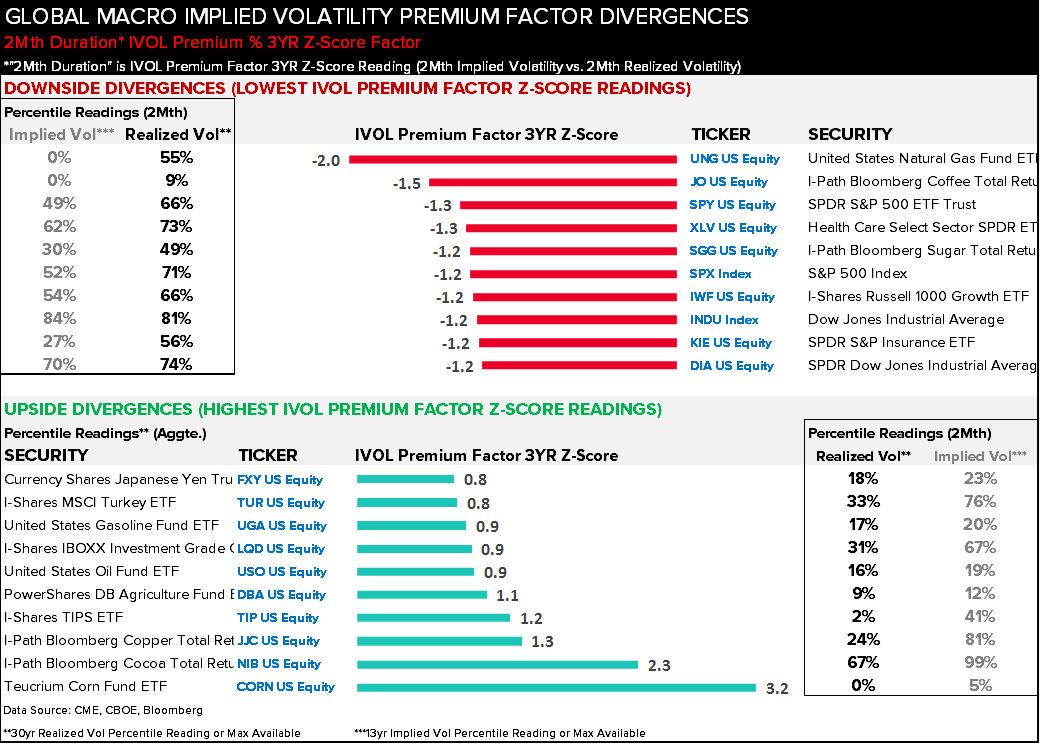
The first two visuals below have over 100 tickers in the screen across global equities and FICC. Implied volatility in the major U.S. indices is trading at nearly half of what realized volatility has been over the last month, which ultimately means that many U.S. equity tickers screen with the largest near-term implied volatility discounts in global macro (Z-Score factor). 9 of the top 10 largest 1Mth IVOL Z-Score discounts are under the U.S. equity umbrella.
Although IVOL discounts aren't uncommon in this volatility environment, rate-of-change reveals the discounts have grown deeper each market session…
30D IVOL discounts:
SPX: -44%
INDU: -39%
RTY: -29%

Implied – Realized Discussion – We talk about this relationship on a daily basis – The “implied volatility premium factor” needs a lot of context. You have to 1) look at the rate-of-change in the factor and 2) know what volatility environment you’re in.
Where are we coming from on volatility?
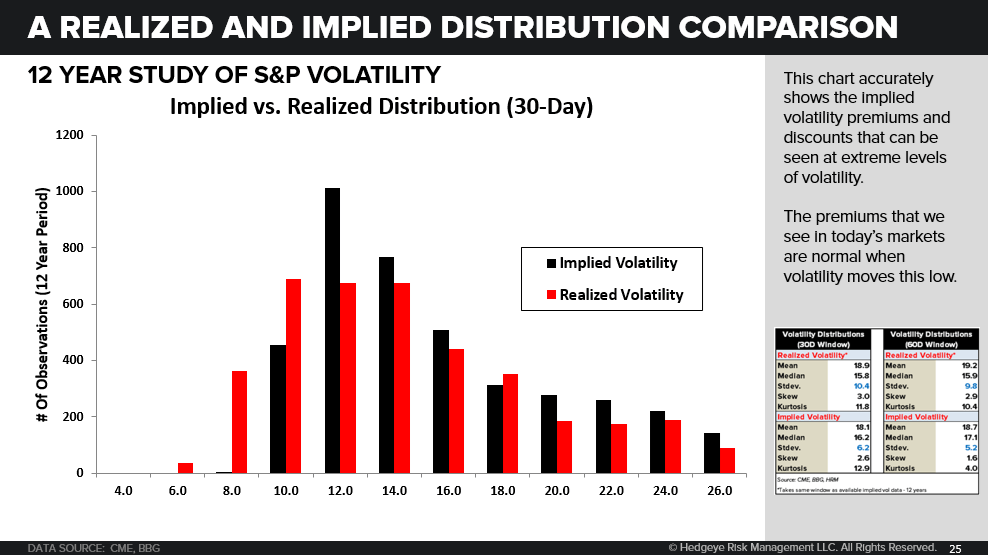
If we look at the historical distribution of volatility, we know it’s the upside down of equity market returns, so the Tail risk is represented on the right side of that distribution. Here are a few important points on how “realized” and “implied” are related with corresponding visuals:
Chart1: Implied volatility bets on mean reversion at the extremes. Nobody sells vol extrapolating all-time lows in realized vol into the future (2017 instance). And after the market goes through a crashier period that forces many market participants to reach for rich volatility, it doesn’t take much for forward expectations to settle down (that’s what we’ve seen now).
Chart2: A zoomed-in view of the historical realized and implied distributions. The descriptive stats in the gutter tell the mathematical story:
- Median implied volatility for the SPX example case is higher than median realized volatility
- Standard deviation is tighter for implied volatility over realized volatility
- Skewness in the historical distribution of implied volatility is less drastic than realized volatility
Chart3: Whether we look at realized and implied at a single point in time or time-match expectations and reality, implied volatility trades at a definitive premium to realized volatility on average. For example on a 30-Day window, the “Time-Matching Volatility Study" compares realized 30-Day volatility today to 30-Day implied volatility 30 days ago. This attempts to answer the question: How often is the amount of forward volatility priced into markets actually realized? Ans: Depending on the duration, about 70% of the time it's not.
*Hopefully this brief primer helps put some color around the steep implied volatility discounts in many U.S. equity volatility surfaces right now.