
TREND WATCH: What’s Happening? Something peculiar is happening in the housing market: Even after rising over the past several years, annualized housing starts stand at just over 1 million today—which is barely half of 2006’s levels. Historical data are even more concerning. Housing starts are now lower than at any previous business-cycle peak going back to President Truman—despite having a much larger pool of potential homebuyers today than in those earlier years.
Our Take: What’s going on? A slowdown in the growth rate of the adult population is one factor. The less obvious trend is behavioral: After falling for decades, average household size is again on the rise, a trend that predates the Great Recession. Quite simply, young adults are no longer in a rush to set out on their own—and their parents are no longer yearning for an empty nest. Going forward, barring a drastic reversal in this behavioral trend or a boom in immigration, the housing market will have to cope with the double whammy of slowing population growth and a growing preference for larger households.
If you’re in the homebuilding industry, you’re aware that America remains mired in by far the weakest housing market of the postwar era. New housing starts over the last 12 months (calendar year 2017) weigh in at a SAAR of +1.2 million. That’s better than where it was stuck before 2015, when it was struggling to get over the 1 million mark. But it is barely half of where it stood at the peak of the last business cycle (Q1 2006: +2.1 million).
And, in fact, it is lower than at the peak of any business cycle going back almost all the way to World War II. The current Census data series on housing units starts in 1959, but earlier data on the U.S. housing stock makes it clear that even the America of the 1950s outbuilt the America of the 2010s.
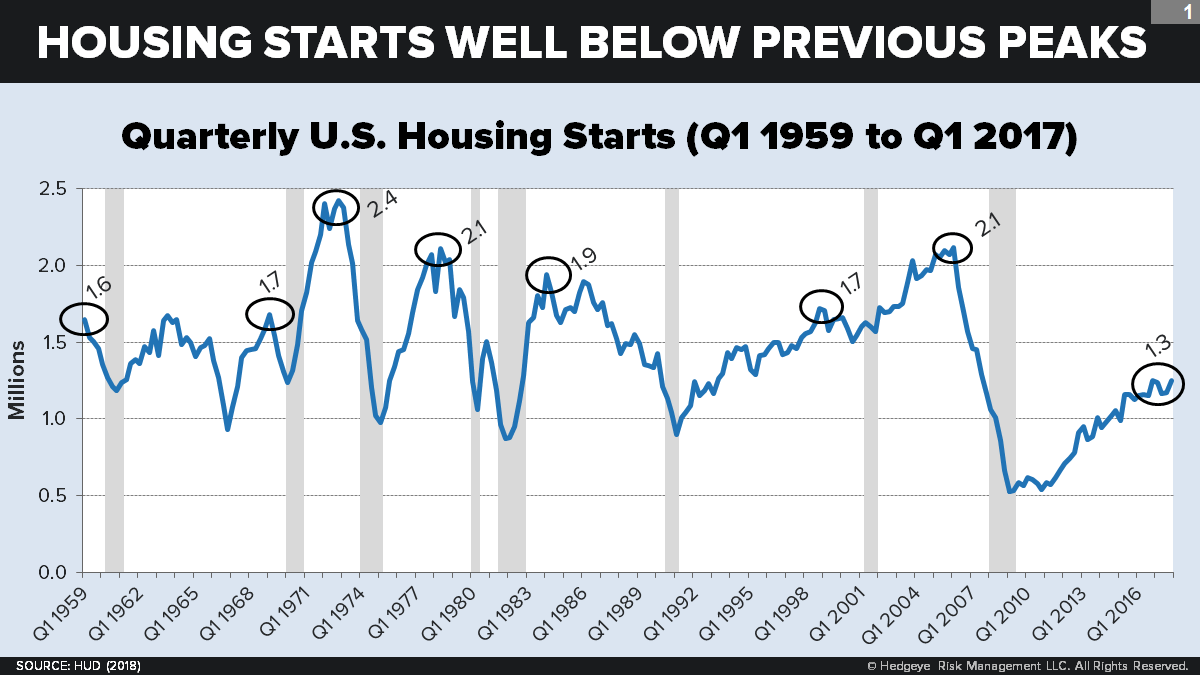
What makes this decline in housing starts truly remarkable it that America today has a much larger population than in those earlier decades. In 1972, for example, America built twice as many houses—even though our adult population back then (at 140.5 million) was only 57% as large as it is today. In 1959, it was only 43% as large. So on a per-capita basis, the decline in additions to our housing stock appears steep indeed.
THE (OBVIOUS) SECULAR TREND: SLOWING POPULATION GROWTH
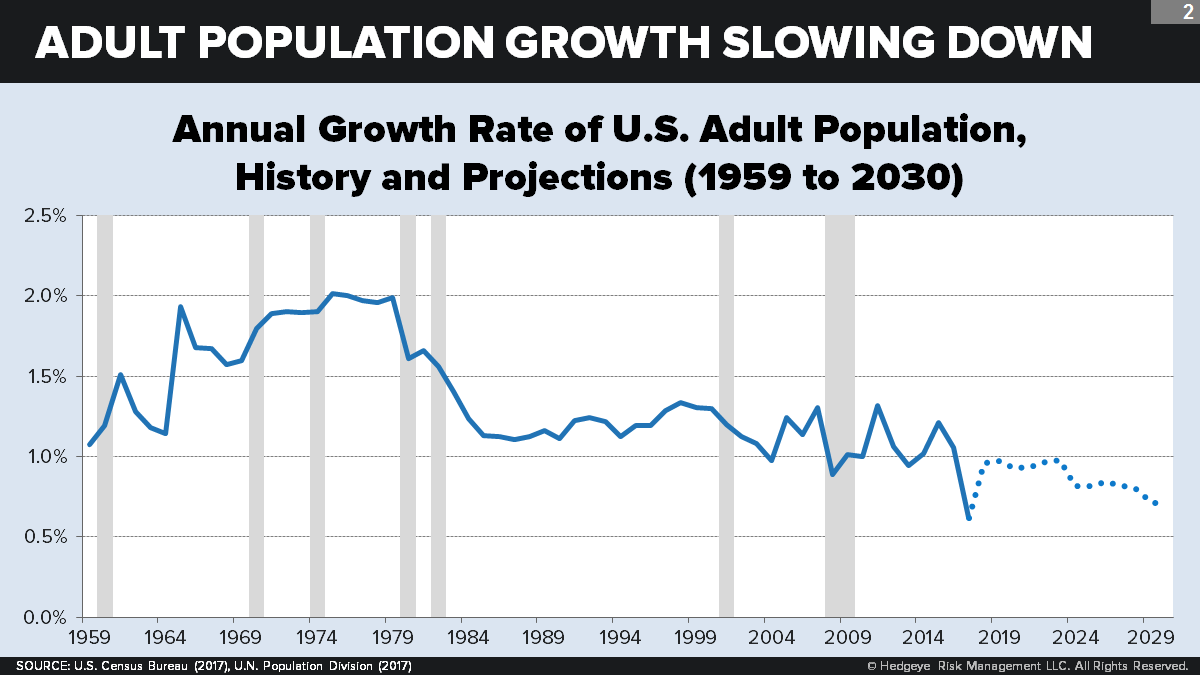
One widely recognized demographic driver behind this trend is the inexorable if halting decline in the growth rate of the adult population over the last several decades. America is a demographically mature society, with a gradually declining total fertility rate. This must lead, over time, to a similar decline in the number of new adults who come of age each year relative to the old adults who pass away each year. Translation: Fewer net “new” adults each year.
The decline is not lockstep, of course. It was “put on hold” for roughly thirty years (1) as the large Boomer generation worked its way into and through adulthood. It has also been buffeted by immigration, which rose from the 1970s through the 2000s. But currently—with birthrates resuming their long-term decline, with Boomers entering their high-mortality age brackets, and with net immigration again falling—the trend is reasserting itself.
As we can see from the following projection (here we use the highly respected U.N. Population Division’s forecast which, unlike the Census’ forecast, is updated yearly), the growth rate will continue to fall through the next decade.
Why does a decline in the net number of new adults every year matter for housing? Because, as a first approximation, it determines the net demand by adults for the purchase or rental of new housing units.
THE (LESS OBVIOUS) BEHAVIORAL TREND: RISING HOUSEHOLD SIZE
But the slowdown in the growth rate of U.S. adults cannot alone explain the decline in housing demand. Something else is going on—namely, a recent failure in the growth rate of households to keep up with the growth rate in adults. Arithmetically, this translates into a rise in the number of adults per household. The Great Recession undoubtedly did much to dampen the buying and renting of homes in 2008, 2009, and 2010 by temporarily forcing families and friends to “double up.” But as the following chart makes clear, this gap between adult population growth rates and household growth rates is by no means a passing phenomenon. In fact, it began well before 2008: Since 2004, adult population growth has outpaced household growth in 10 of these 14 years—sometimes by a wide margin.
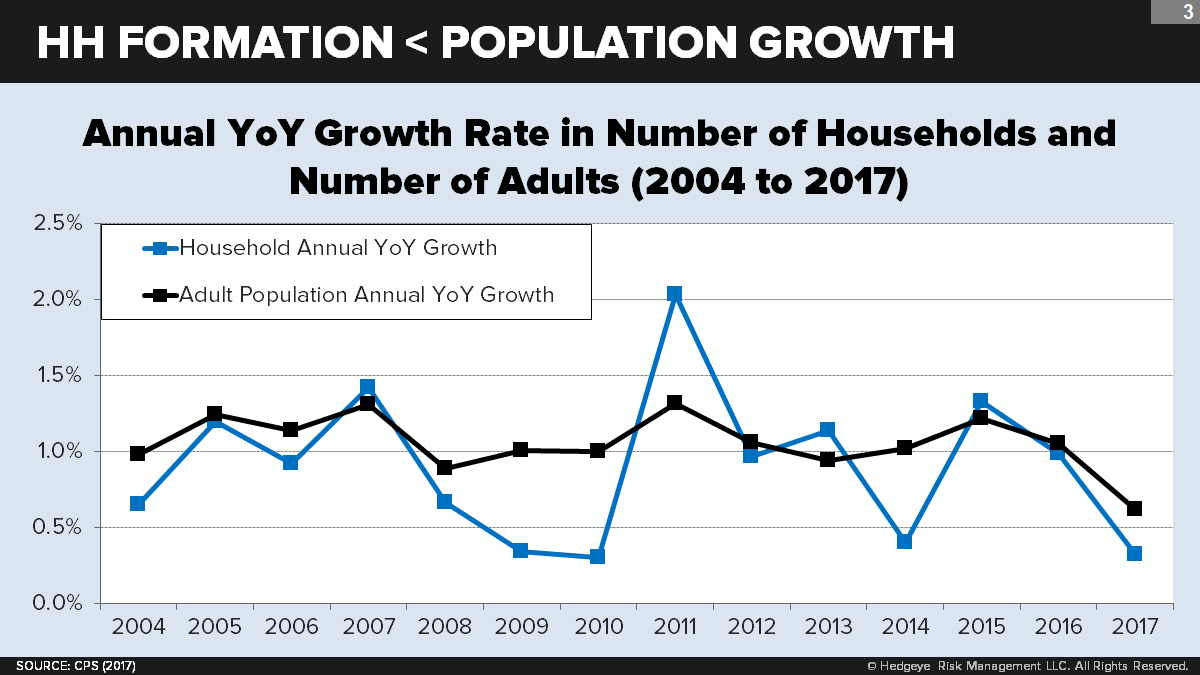
The quantitative impact of this trend has been profound. Since 2003, population has grown 2.5% faster than household formation. Thus, if it were up to population alone, there would be 2.2% more households than there are today—a figure that equates to nearly 3 million missing homes.

So what’s happening? On top of population-level effects, shifting behavior patterns have further constrained the housing market.
We’re talking about a sea-change reversal in household size. For most of the postwar era, the average number of adults per household was on a steep downward trajectory. In the 1950s and 1960s, the decline was ushered in by the spread of suburban single-home developments, which put an end to the overcrowded “Frank Capra” Victorian homes of the 1930s and 1940s. The new “nuclear family” household (no grandparents, no relatives, no in-laws) was born.
In the 1970s and 1980s, household size continued to decline, driven partly by the new “going solo” lifestyles of a large new generation of young Boomers and also by the divorce revolution and “senior living” developments which further fragmented households into ever-smaller bits. During the 1990s and early ‘00s, the downward trend persisted, albeit at a much shallower trajectory—now driven by falling mortgage interest rates and sizeable gains in real median family income.
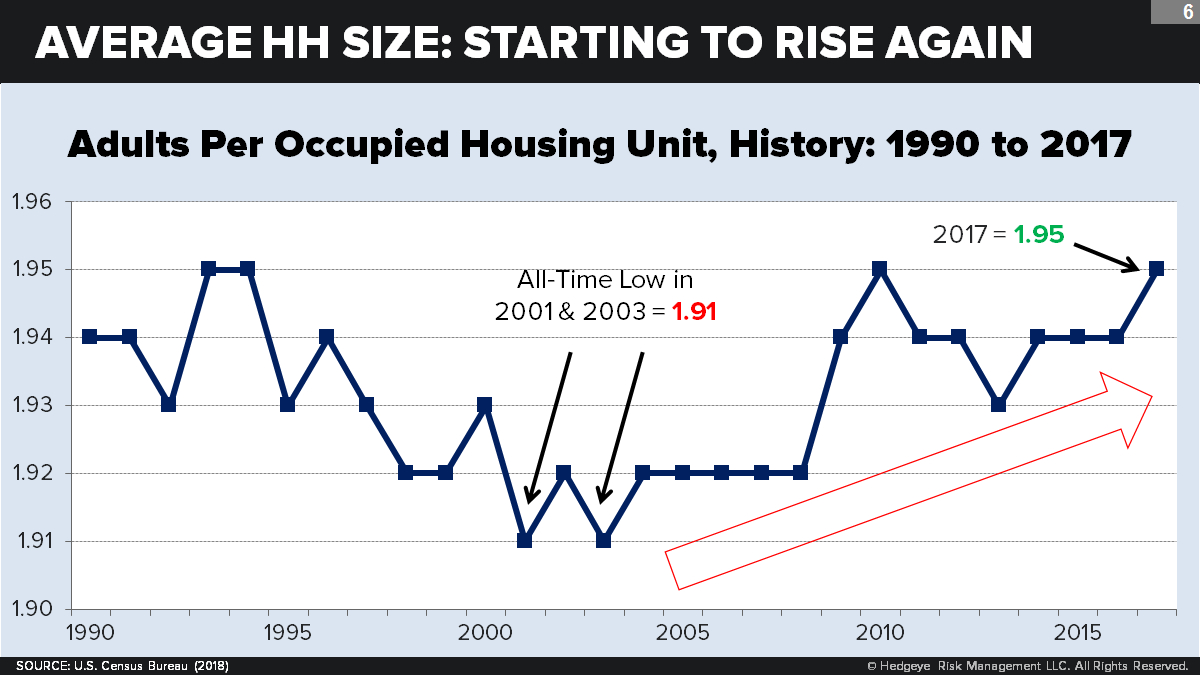
The all-time low in average household size (1.91 adults per household) was reached in 2001 and 2003. Ever since, the size has been gradually rising.
To recap: During the earlier postwar decades, especially during the American High, falling household size was a powerful tailwind to housing construction. Over the last fifteen years, rising household size has been a headwind.
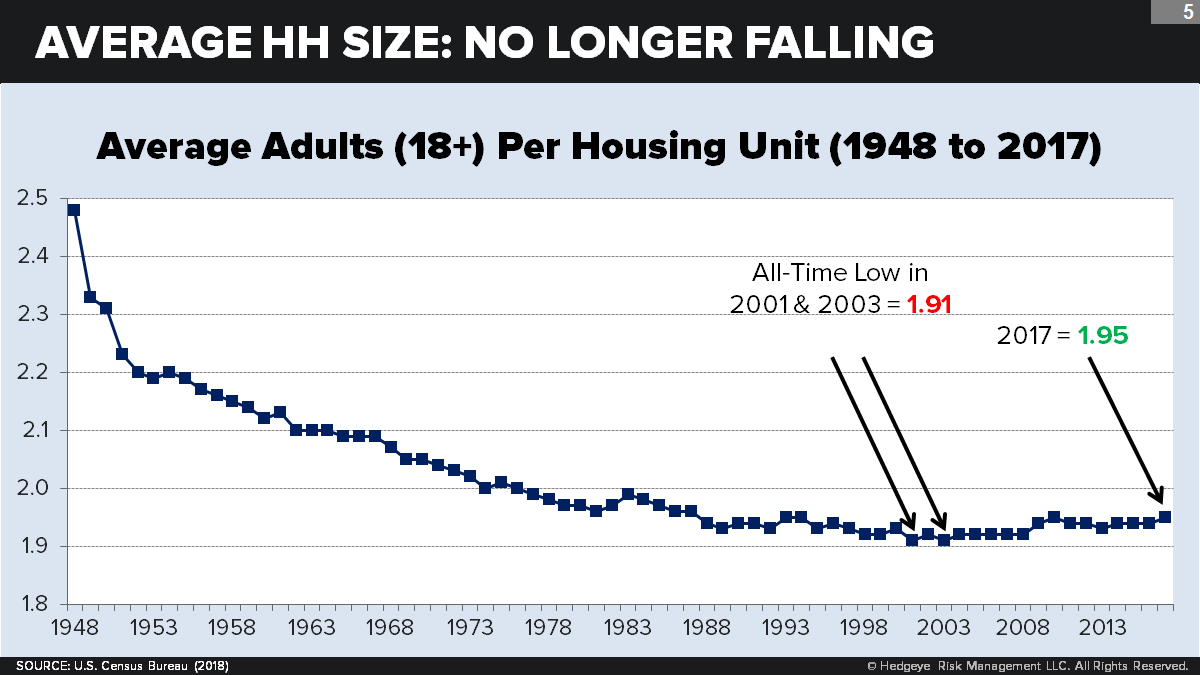
The following chart takes a closer look at average household size since 1990. What’s noteworthy? First, contrary to what we might expect, household size actually rose slightly during the years of the housing bubble (2003 to 2008). Second, household size exploded during the Great Recession and its immediate aftermath. Third, while declining temporarily from 2010 to 2013, household size has more recently been climbing again—all the way back to its 2010 high of 1.95 in 2017. The climb has defied expectations. Keep in mind: Mortgage rates have lingered near record lows, markets have recovered (and then some), and real median household income has surged.
The economy alone, in other words, cannot explain this ongoing “re-crowding” of U.S. households. What can explain it is an ongoing generational shift toward the renewed acceptability, even desirability, of group lifestyles. Much of it can be ascribed to a trend we call the “renaissance in extended family living”—in which:
- Young adults are more likely to choose to live with their midlife parents or other older relatives (and their parents and other older relatives to live with them).
- Young adults are more likely to live with each other.
- Older adults are more likely to choose to live with relatives (especially those who are childless).
- Single seniors are more likely to choose to share residences with each other.
- Relatively higher male life expectancy is reducing the share of senior widows who live alone—which tends to raise the average size of 65+ households.
Roughly speaking, these drivers are listed here in order of their quantitative importance. So what’s driving the drivers? Mostly, generational change. The biggest shifts are driven by the coming of age of Millennials, who are much more accepting (than Boomers or Xers were at the same age) of living with their parents and with each other. Yet other generational changes also play a role. Boomers, for example, are much more willing to allow or invite their adult children to live with them than the midlife Silent or G.I.s were with their own adult children. (See: “Does Co-Living Threaten the U.S. Housing Market?”)
Not all social and generational changes are pushing in the direction of larger households. As we shall see, some changes (especially among Boomers) are pushing the other way. But clearly, these negative forces are losing.
QUANTIFYING THE EFFECT OF GROUP LIVING
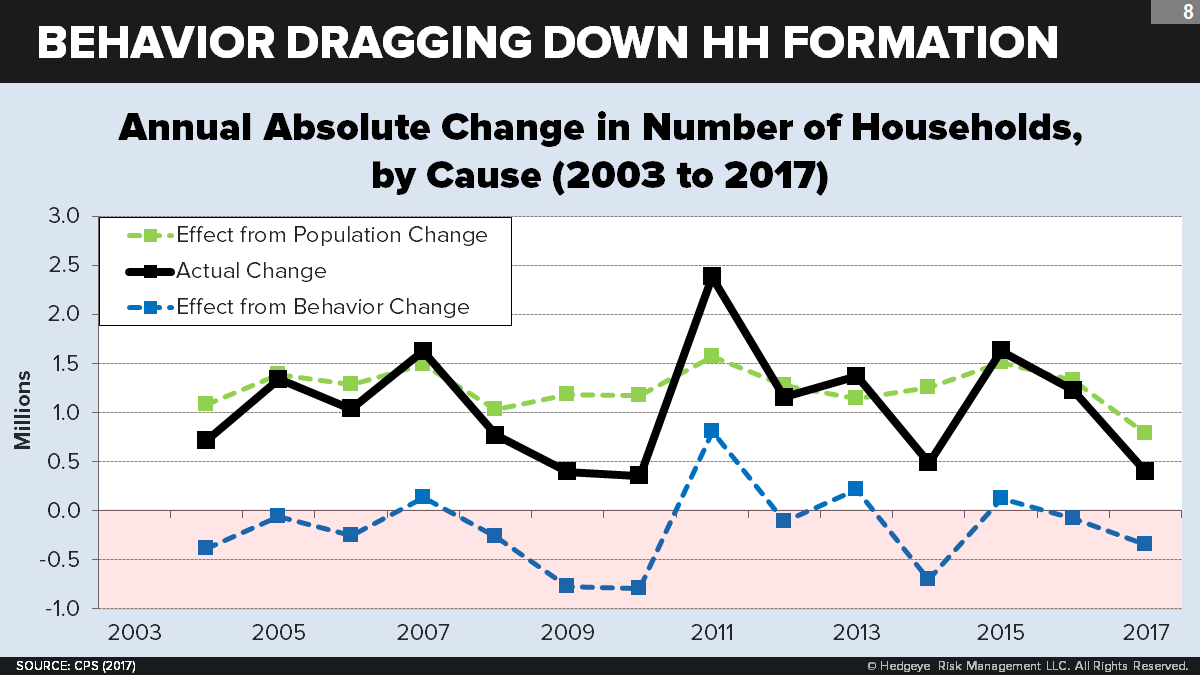
Let’s now step back and take a closer quantitative look at household growth by decomposing it into two causes: adult population growth and behavior change (i.e., changing number of adults per household). By holding one constant, the effect of the other can be seen over time.
As expected, adult population growth over the last 15 years has been a constant positive force pushing the rate of household formation up. In almost every year (except 2017), it has been around +1.0%. Behavioral change has been more erratic. More importantly, it has been mostly negative—with only one year of significant positive change (2011). This tracks well with a one-year post-recession homebuying rebound.

This trend looks just as dramatic in absolute terms. Since 2007, behavior change has had a significantly negative impact on the total number of households. Nearly 1.9 million households have been lost, cumulatively, due to more adults living together. That’s 190,000 fewer new households, every year, over the past decade.

A GENERATIONAL SNAPSHOT
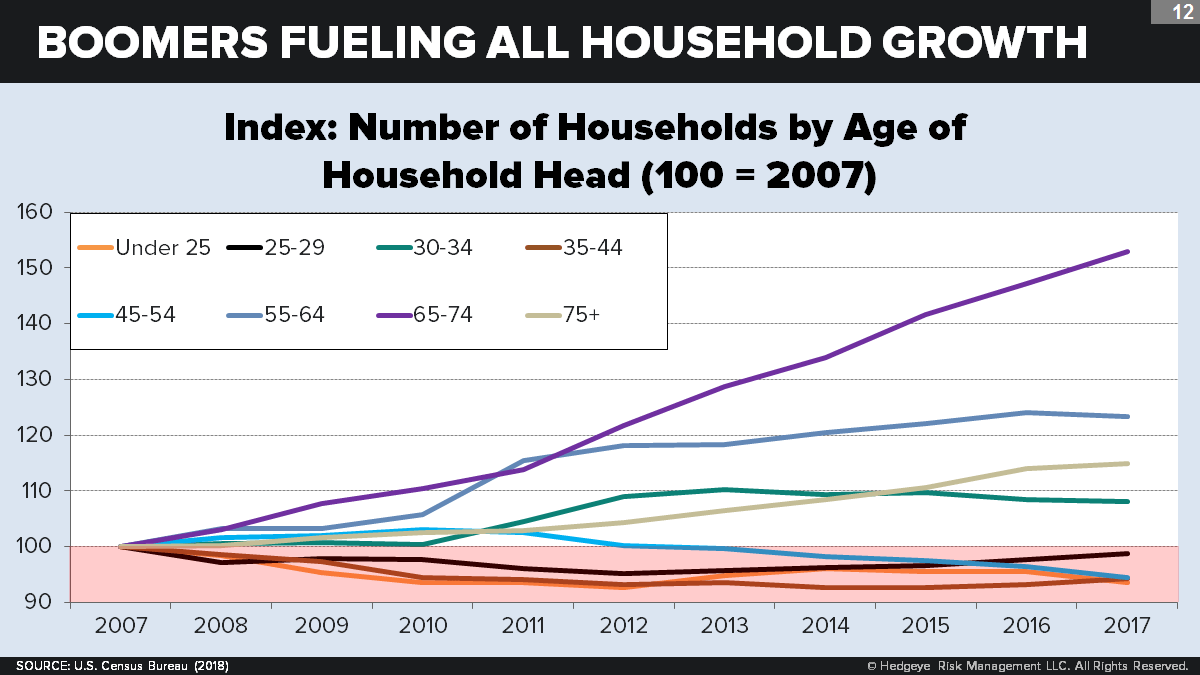
Now let’s break this down by age bracket. Which age bracket—and which generation—is actually responsible for pushing these population and behavioral changes? Let’s take a look, from youngest to oldest. (See the following chart.)
One caveat: The households “belonging” to each age bracket are those with household heads (as recorded by Census surveys) who belong to that age bracket. This doesn’t affect the aggregate population numbers. But it can affect age-group numbers—e.g., when a Millennial lives with his or her Boomer parent.
- 18-24: Late-wave Millennials (5% of all households): These younger Millennials comprise just a sliver of all households, but this is a case in which a negative behavior shift has completely overwhelmed positive population growth. From 2008 to 2017, assuming unchanged rates of family formation, this age bracket should have added over 200,000 households. Instead, they subtracted 400,000 households. Driving fewer households per adult in this age bracket is a long lineup of familiar trends: more post-secondary attendance; staying in school longer; steeply declining marriage and fertility rates; more protective parents; and a greater willingness to live with friends and family.
- 25-34: Early-wave Millennials (16% of all households): Here is where the impact of behavior hits harder than in any other age bracket. The same trends that apply to late-wave Millennials also apply here, only to greater quantitative effect (because of the much larger pool of prospective householders). Due to population growth alone, we should have seen 25- to 34-year-olds heading 2.1 million more homes in 2017 than they did in 2007. Instead, they headed just under 700,000 more. Some 1.4 million households, gone like that. Poof!
- 35-44: Late-wave Gen Xers (17% of all households): Today comprising the depths of the 1970s-era baby bust, this age bracket’s homebuying activity over the last decade was hugely limited by its shrinking size: Over the last decade, its household number shrank by 1.3 million. Uniquely, however, this is one case in which behavior change actually had a small but positive impact on household formation. Why? Reaching adulthood at the height of the housing boom, these late-wave Gen Xers were enticed to buy homes beyond their means. Perhaps they ended up owning more homes than they could afford—and almost surely more than the preceding cohort (early-wave Xers) bought at the same age. Even today, this age bracket remains the most likely to be underwater on their mortgages.
- 45-54: Early-wave Gen Xers (18% of all households): Although the size of this first wave is larger than the second wave of Generation X, it is overmatched by the still-larger Boomer generation it followed—hence the still negative, though smaller, effect of population. Yet this group’s behavior turned out to have a large and negative impact on buying and renting homes. One possible explanation is that these midlife Xers, compared to the Boomers right before them, are experiencing somewhat lower rates of divorce and childlessness. Another is that they are more economically constrained to live together. (Alas, the divorce rate does correlate positively with economic growth.) The negative overall household shift in this age group is especially bearish for the higher-end trade-up market.
- 55-64: Late-wave Boomers (19% of all households): Due to their massive size, these late-wave Boomer cohorts have contributed huge numbers relative to the early-wave Boomers they follow (roughly +4.3 million). Behavior effects, however, are mixed. On the one hand, a rising divorce rate and a greater propensity to borrow against home equity is a net positive for housing. On the other hand, being the homeowner of record for so many adult Millennial children—and less well-off than the cohort just older than they are—cancels out much of that gain. On net, this group’s behavior added another 250,000 households.
- 65-74: Early-wave Boomers (14% of all households): Again, we see a huge rise in household formation due to population (over +6.4 million) compared with the small (Silent) cohorts just before them. Yet here we see virtually no net behavioral impact at all: Countervailing trends apparently negate each other, and for most of the same reason as for late-wave Boomers. Perhaps the biggest difference is that there are fewer young adults living with them. Also, there is less of an affluence gap between them and the (well-off) late-wave Silent who came along just before them.
- 75+: Mostly, Silent Generation (11% of all households): For seniors age 75+, the salient trend of the last decade has been a dramatic increase in real median household net worth. The elder and poorer G.I. cohorts, many of whom came of age with the Great Depression, have been passing away; and the newly arriving “lucky generation” cohorts, born in the late-1930s and early 1940s, have done unusually well both economically and financially. (See: “The Graying of Wealth.”) Greater affluence, combined with a growing aversion to long-term institutional care, is a big positive for household formation. These gains, however, are wiped away by a contrary trend: the recent “catching up” of male expectancy with female life expectancy, resulting in a large reduction in the share of late-elderly (age 85+) women who are widows living alone. All told, behavior changes netted to zero for this age bracket over the last decade.

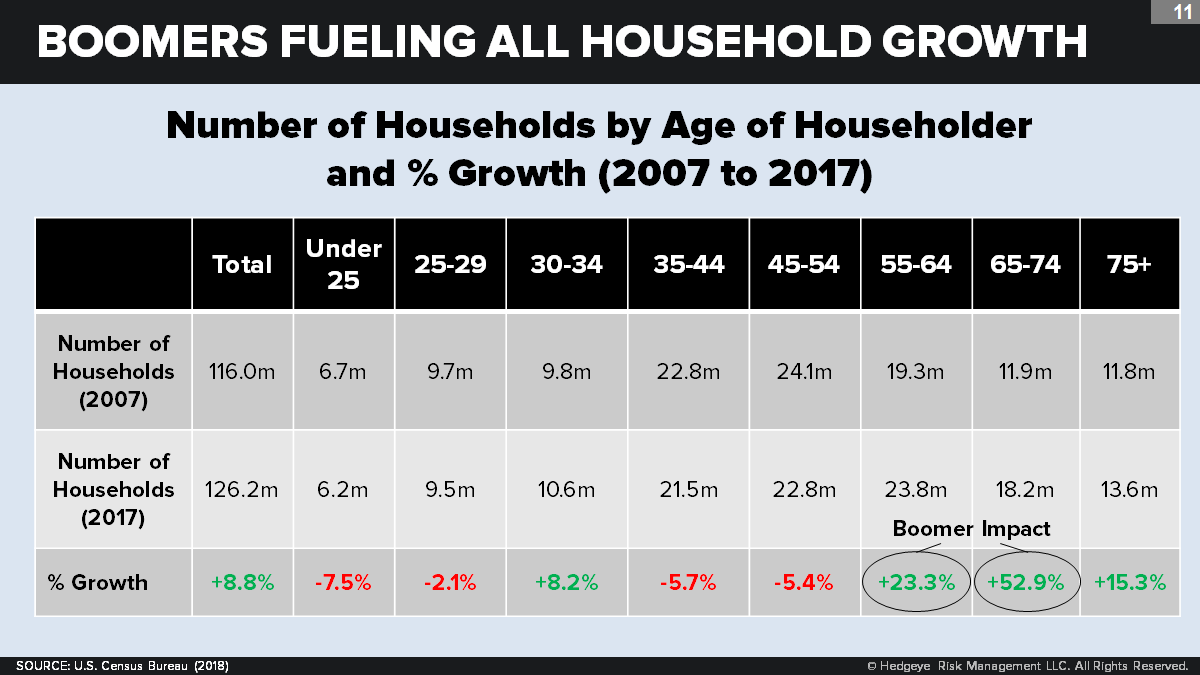
So which age groups are responsible for the increase in the number of U.S. households from 2007 to 2017? Everyone over age 55. Thanks to the sheer dint of Boomer numbers—combined with the negative behavioral shifts in younger age brackets—Americans age 55 to 74 are responsible for more than the entire growth in household formation over the past decade: They’ve accounted for 11.8 million new households, compared to the 10.3 million new households created by all Americans. The deficits created by the “baby bust” Gen Xers should have easily been overwhelmed by the surpluses created by the “echo boom” Millennials plus the longer-lived Silent and G.I.s. But they weren’t, due largely to the significant negative behavioral shifts by the Millennials and the early-wave Xers.
All age brackets below 55 now account for 2.3 million fewer overall households than they did in 2007. So much for a huge new Millennial housing wave that was supposed to power the entire market. (See: “The Millennial Housing Wave: For Real?”)
WHAT’S IN STORE?
Given these trends, what is the likely future for the housing market?
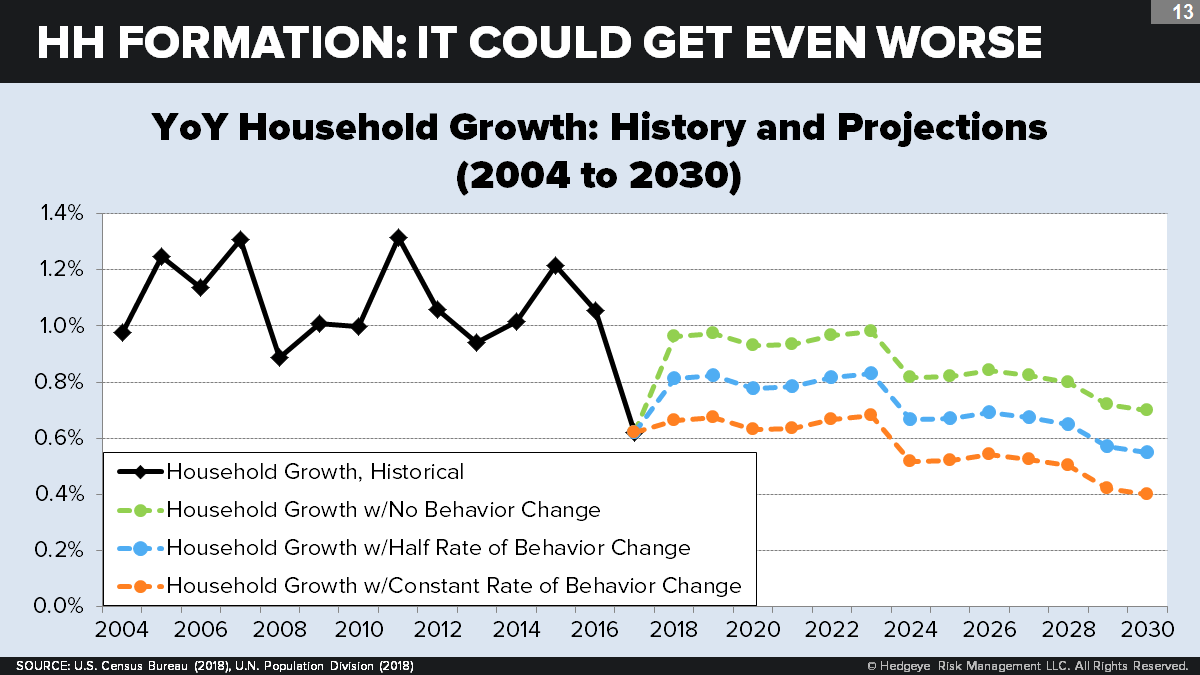
Since the overall growth rate in the adult population is projected to slow between 2017 and 2030 (see again: our second chart), the next decade is likely to see a continuing slowdown in the demand for net new housing units. Consider that, even if recent bearish behavioral trends cease completely and household growth is fully powered by population growth, we will still see less than 1 million households added annually by 2030. If, on the other hand, behavior changes are here to stay and continue to raise household size at the same rate that they have over the last decade, we will see only 500,000 new households by 2030. A conservative estimate of a lessened (but still bearish) impact of behavior change would result in 760,000 new households by 2030.

These are grim forecasts for the housing industry.
To be sure, nothing is written in stone. On the demographic side, the “natural growth” components of adult population change can be forecast with great accuracy. Any change in fertility will have no impact on the number of adults capable of forming households for at least 20 years. And no plausible increase in life expectancy above assumptions (lately, we’ve had negative surprises here) is likely to offer significant improvement. The one wild card is immigration. One reason we use the U.N. projections is that they accurately reflect the recent downturn in net immigration. But if you believe that immigration will soon begin to climb way above its recent trend, that could have a significant positive impact.
The other wild card, of course, is behavior. If you believe that Millennials—despite recent evidence after an eight-year economic recovery—are still a coiled spring of loners just yearning to flee their families and flee each other, then yes, this too could turn a headwind into a tailwind. But that’s a bet you need to make at your own risk. We think this generation’s preference for community, co-living, and multigenerational households has been amply demonstrated. And we think its influence on household formation will only grow stronger as they mature and move into older age brackets.
