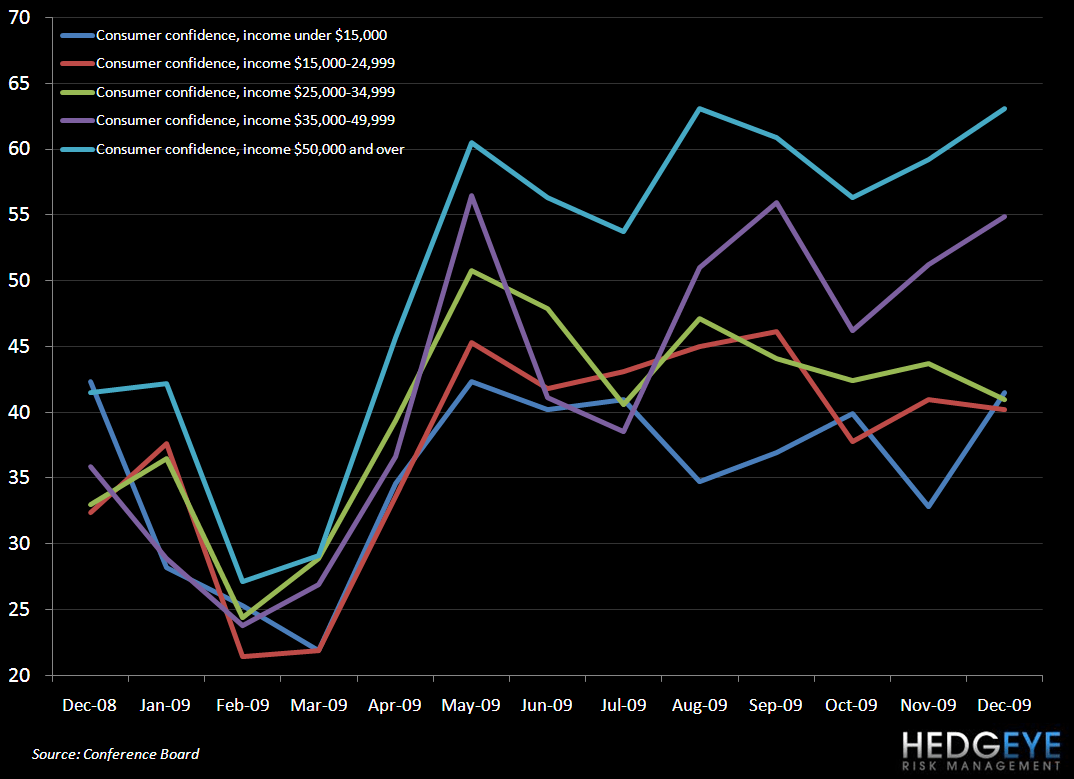
Consumer confidence bottomed in early 2009. In early 2010, divergences in consumer confidence among income groups will be worth watching for restaurant investors.
The chart below clearly shows a split in consumer confidence between those earning salaries of $35,000 and over and those earning $34,999 and below. Since October 2009, the wealthier segment of the population has seen a significant boost in confidence, while lower income levels have seen stagnating, or even deteriorating, levels of consumer confidence.
Looking at quarterly comparable-store sales metrics for restaurants by average check, it is clear that trends have been improving in restaurants with average check of $45+. The third calendar quarter has seen a slight tick up in trends for the $5-10 average check group. It is worth noting, however, that some of the 4Q comparable sales numbers that have been released by companies whose average checks fall within $5-10 have been negative. Carl’s Jr. has released comparable-store sales for two of the three periods of the fourth calendar quarter. Thus far for the quarter, comparable-store sales have been approximately -8%. In addition, Sonic’s comparable-store sales for the quarter ended November 30th (not included in the chart below) declined -9.1%. We anticipate declines in the trends for these companies going forward, assuming the divergence in consumer confidence between income levels remains.
Between restaurants with average check between $10-20 and $20-27.50, it seems that the $20-27.50 average check group saw more stability in the last quarter than those restaurants with average check between $10-20. At this point, it is difficult to draw a firm conclusion from the data available, but we will be paying close attention to the consumer confidence trends, comparable-store sales at various average check levels, and the relationship between the two metrics.

Below is a table indicating the companies whose data was included in the chart above:
