Over the past two days we have gotten some incremental data points on the US housing market, none of which leaves me convinced that a real turn in housing is near. Regarding today’s Case-Shiller news, I’m not going to get too excited about a statistically insignificant data point.
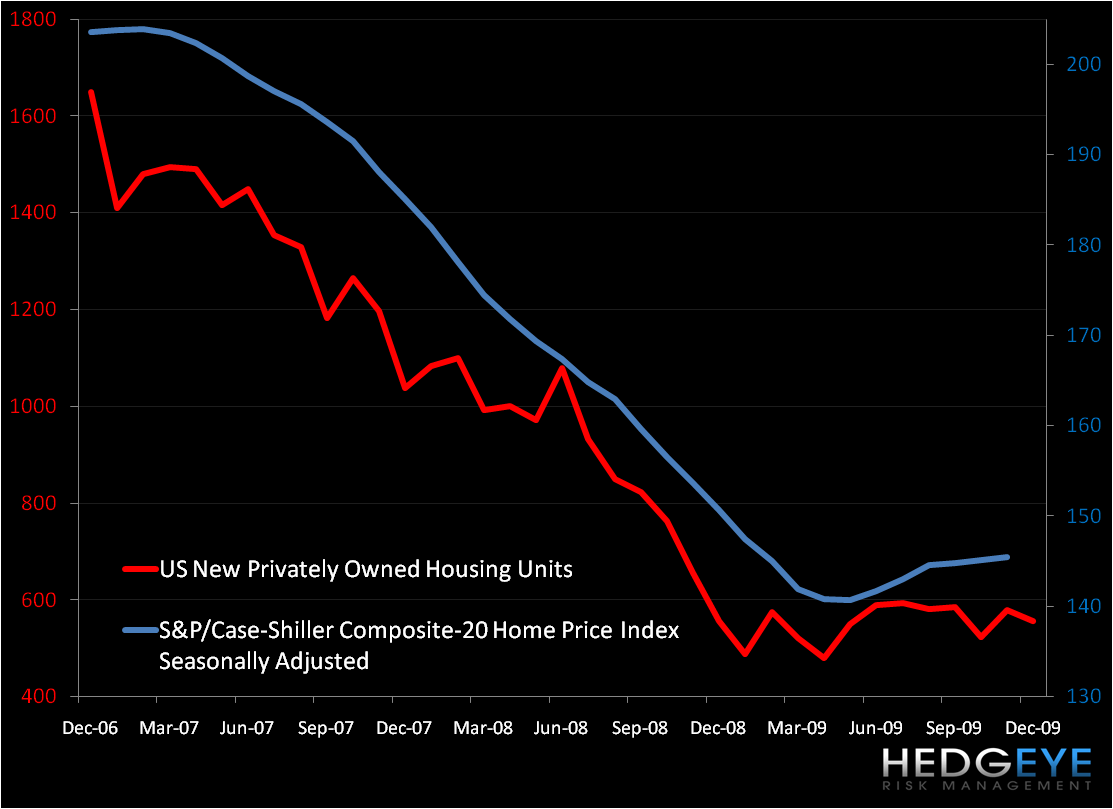
Based on the Case-Shiller data, the worst of the housing market is over with home prices, as reflected by the 20-City Composite, rising in November for the sixth consecutive month (on a seasonally adjusted basis). The S&P/Case-Shiller home-price index increased 0.2% from last month, after a 0.3% rise in October. Year-over-year, the index was down 5.3% from November 2008; the smallest year-over-year decline in two years.
The fact that the worst for the housing market is in the rear view is not new news and has certainly been discounted by the 62% increase in the S&P 500 since March 9, 2009.
Our “HOUSING GONE WILD” post from yesterday discusses the decline in the December existing home sales number. This falloff in home sales, combined with other factors, which we outline below, strengthens our conviction that job growth will be the lifeblood of any sustained “recovery” in housing.
Outside of recent demand driven by tax credits, there is clearly underlying softness in the housing market. Though it may try, the government cannot afford to support the market in perpetuity.
DEMAND:
If aggregate demand is not sufficient, there could be significant excess capacity in the market. Census data shows that household formation has been slowing meaningfully over the past number of years and we believe that 2010 will fall in line with that trend.

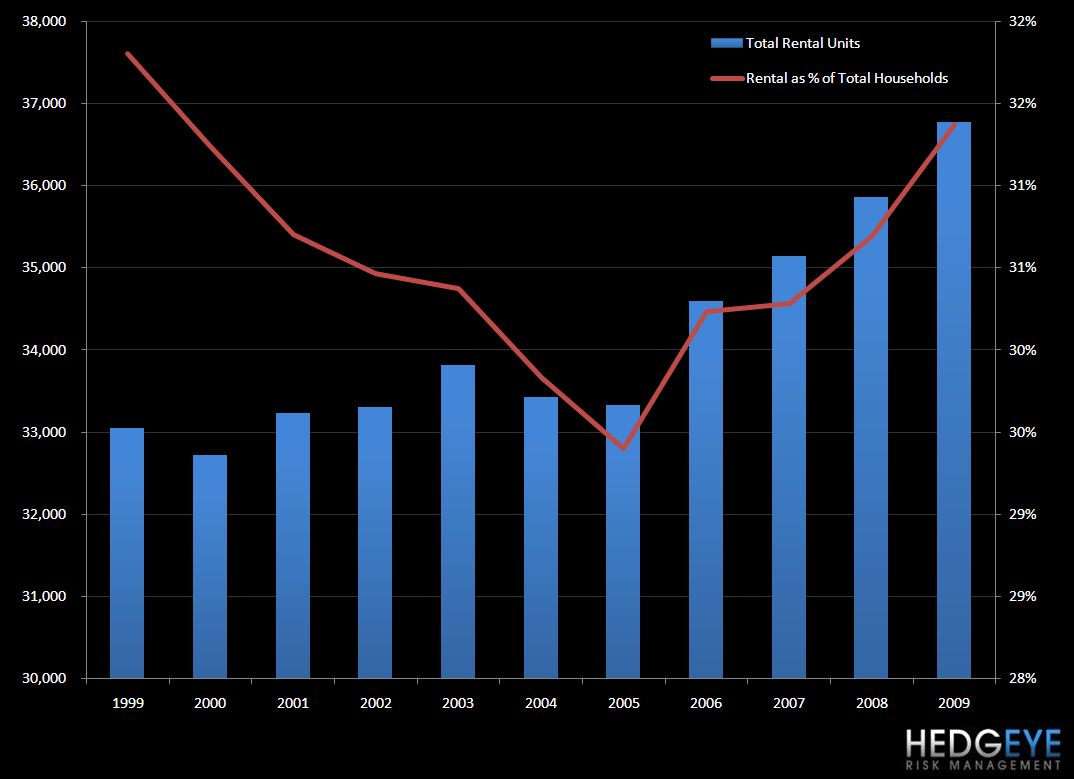
In addition, there has been an increase in rental households in the United States. Home ownership is likely to become less of an option in the future with access to capital tightening and the cost of it increasing. The chart below illustrates the boost in rental households in the United States since 2005. As a percentage of total households, rental properties are still not at 1999 levels (red line in chart).
Any change in the level of immigration into the U.S. would impact overall demand for houses and we have heard, anecdotally, from some restaurant companies that people are leaving as jobs disappear. Specifically, in reference to regional QSR demand trends, CKR management stated, “So it's really a state-by-state issue and illegal immigrants leaving one state for another state will hurt the restaurant business in the state they leave, not because we can't employ them but, I mean, where do you think those guys eat? They are late farm laborers and construction workers and you've got severe unemployment in certain Western states which will impact June…”
Supporting CKR’s comment, the Brookings Institute recently reported that the number of arrests at the U.S.-Mexico border, which is an indication of illegal crossing activity, dropped by more than 23% in 2009 to a 34-year low point. The article attributes the lower number to “precipitously declining economic opportunity combined with beefed-up enforcement.”
SUPPLY:
Building permits seem to be indicating a possible increase in construction going forward. Should this come to pass, it could add further stress to an already fragile market that has been leaning on Uncle Sam’s crutch. In addition, inventory growth in recent years will continue to burden the market (as illustrated in the second chart below).


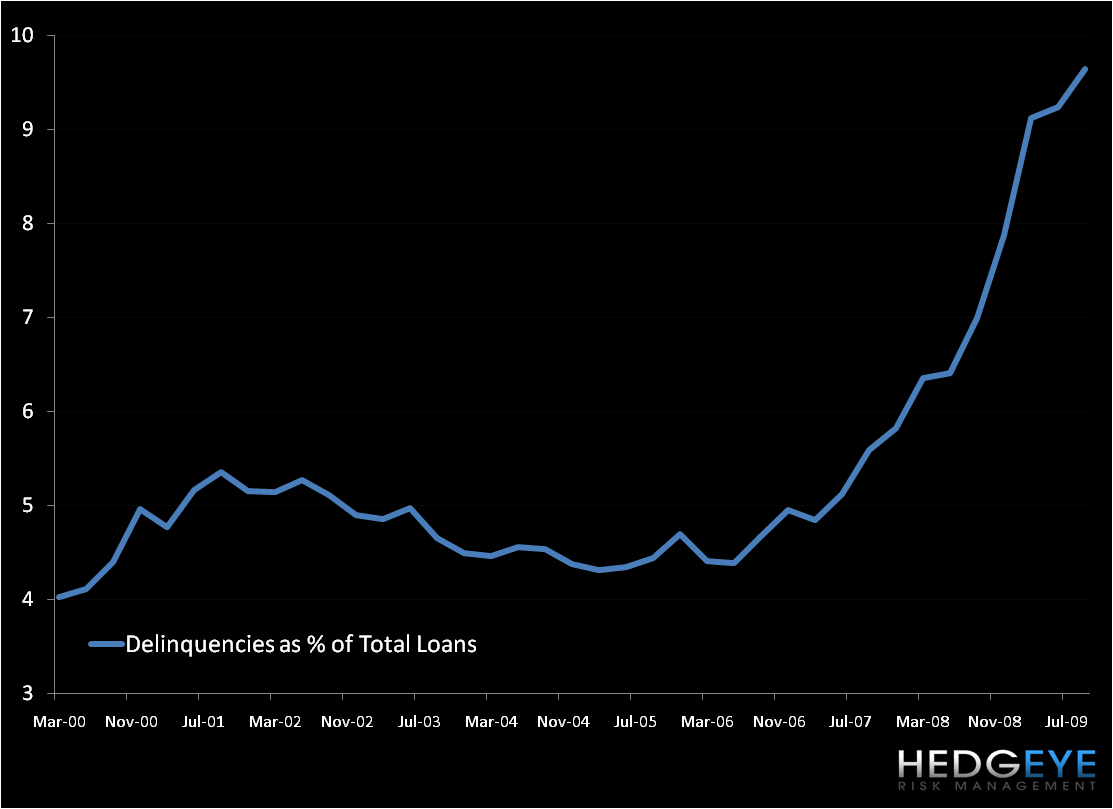
While housing inventory growth has slowed, the tsunami of inventory that came online in the years before the crash has not been absorbed. In addition, there is the unquantifiable SHADOW INVENTORY, which reflects those homes that are on the balance sheets of financial institutions. Although we have seen a decline in inventory, mortgage delinquencies as a percentage of total loans continue to rise.
Consumer appetite is certainly not going to meet this supply with unemployment at 10% and credit card debt data indicating a consumer that is hunkering down (as shown below). Complicating this fact further is our “RATE RUN-UP” theme. We believe the Fed is behind the curve and that 30-year mortgage rates are going higher. The simple math behind a median home price of $178,300 at a rate of 5.11% yields a monthly interest payment of $759; at 6%, the monthly payment is $892 (17% higher) and at 6.2%, the monthly payment is $921 (21% worse).
Increasing jobs is the only way to get the economy weaned off government life support.

Howard Penney
Managing Director