Editor's Note: Below is a brief excerpt from today's Early Look written by CEO Keith McCullough. Click here to learn more about the Early Look.
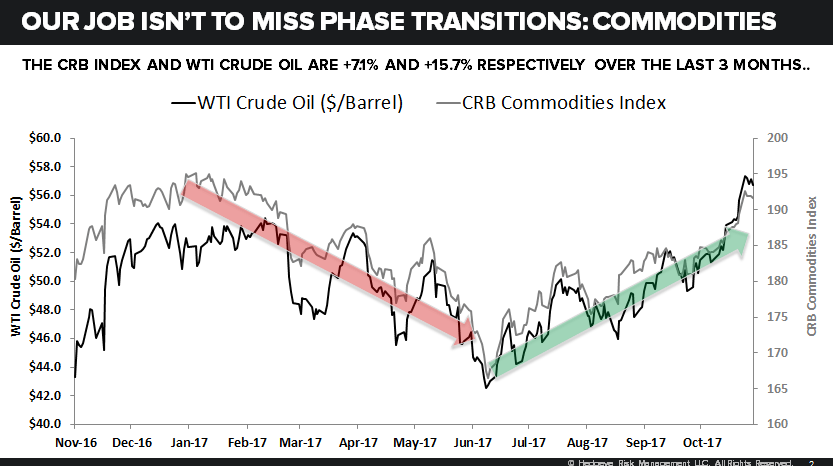
Looking at Commodity Reflation more broadly you’ll see that ex-Ag (Corn down another -1.4% last week to -9.6% YTD), commodities have had an impressive run in the last 3 months with the CRB Commodities Index and WTI Oil +7.1% and +15.8%, respectively:
- CRB Commodities Index – was up another +1.2% last week to -0.4% YTD = Bullish TREND @Hedgeye
- Oil (WTI) – was up another +2.0% last week to -0.6% YTD = Bullish TREND @Hedgeye
- Natural Gas – broke out +7.7% last week to -13.3% YTD = Bullish TREND @Hedgeye
- Lumber – inflated another +4.5% last week to +24.5% YTD = Bullish TREND @Hedgeye
- Gold – bounced +0.4% last week to +9.3% YTD = Bearish TREND @Hedgeye
As you can see, just because something is “up” or “down” YTD doesn’t make it a Bullish or Bearish TREND @Hedgeye.
