With very easy year-over-year comps, we thought it would be instructive to look at 2 year comps as a gauge of the underlying trends.
It is no secret that RevPAR has been getting less bad. Certainly, lodging stocks seem to reflect that trend. It remains to be seen, however, whether the underyling demand is actually getting stronger sequentially. Year-over-year comps are very easy.
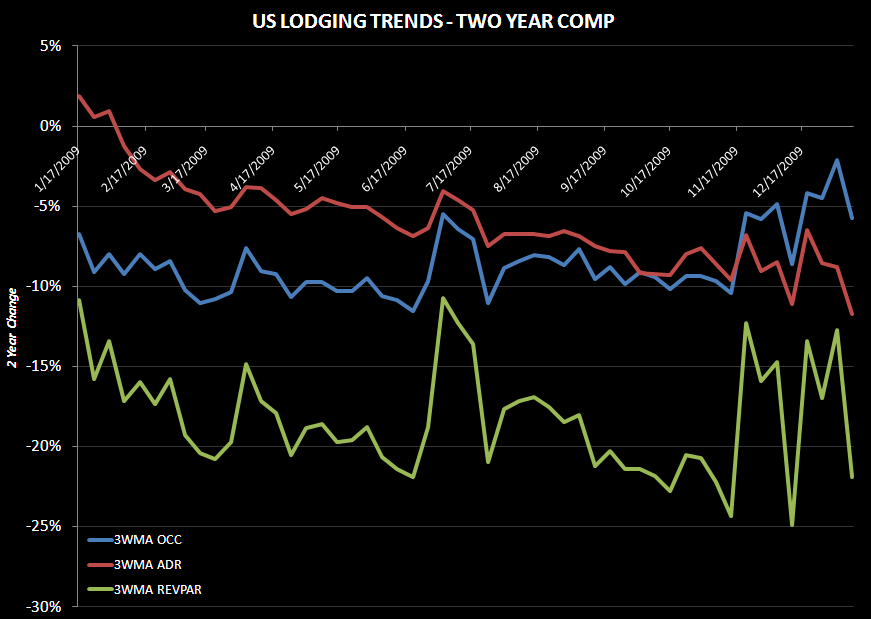
The following chart tracks RevPAR, occupancy, and average daily rate on a two year comp basis. Here, the trends are not so conclusive. On the one hand, occupancy looks like it is on an upward trajectory. However, the ADR trend is negative and RevPAR may be as well. Certainly, the recent 3 week moving averages are not comforting, not even occupancy. In fact, on a two year basis, weekly RevPAR declines eclipsed 30% in two out of the last three weeks and three out of the last seven. Even on a one year comp basis, the the slope of the moving averages has turned down. The coming weeks should be enlightening.