“These are two aspects of one reality.”
-Benoit Mandelbrot
In the spirit of explaining what the actual data and markets are doing (vs. what US Growth Bears thought it should be doing), I’ve relied heavily on my man, The Brot, in 2017. I see no reason why I shouldn’t lean on his fractal teachings again this morning.
Do you think yesterday’s all-time closing high for the US stock market (SP500 = 2488, +11.1% YTD) was wild? Or did it make sense? Was it more of the same, or is it just a “bubble”, or something like that?
Mandelbrot taught me how to build a multi-duration, multi-factor, macro model using both a metaphor and math. He called two distinct forms of market behavior the Noah Effect and the Joseph Effect.
|
“They mix together like two primary colors. Evidence suggests each market – wheat, cotton, Dollar/Yen, SP500, or GM – may have a different hue, a different mix of the two forms of wildness… The Joseph Effect depends on the precise order of market events, while the Noah Effect depends on the relative size of each event.” (The MisBehavior of Markets, pg 202) |
With no disrespect to the concern and prayers we should all have for those affected by the recent floods, the market’s race to all-time highs yesterday suggests that the relative size of Irma was “less” than the market initially expected.

Back to the Global Macro Grind…
Unlike the majority of market strategists we compete with, Mr. Market has nailed pretty much everything so far in 2017. Everything that matters, from a growth and inflation perspective, that is…
1. JOSEPH EFFECTS:
A) INFLATION - US Reflation Peaked in Q117 and rolled over in Q2/Q3
B) GROWTH - US Real Growth has been #Accelerating vs. its 2016 lows for all of 2017
2. NOAH EFFECTS
A) INFLATION – relative to both Fed and market expectations, Reflation’s Rollover was #big
B) GROWTH – relative to both Fed and market expectations, the market is front-running the Fed, #bigtime
Since it’s Q3… and our highest q/q SAAR forecast for US GDP has always been in Q3, will it surprise me if we’re right with a +4.2% GDP forecast in Q3? Nope. A number like that wouldn’t surprise the market with Tech (XLK) +21.7% YTD either.
Will the relative size of a GDP number like that confuse or excite people? That depends how A) they’re positioned and/or B) how political they’ve been about their positioning in 2017, I guess…
Reminder on hard-to-accept-data like US GDP and US Productivity (which wasn’t focused on by mainstream media bears but was reported at a fresh YTD high of +1.35% year-over-year last week):
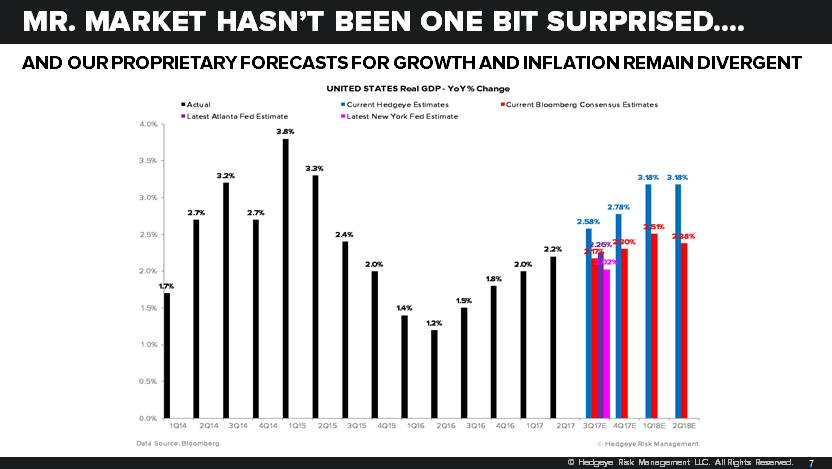
A) Our +4.20% US GDP forecast is the q/q SAAR number
B) Whereas our year-over-year GDP forecast for Q3 = +2.58%
As opposed to opining on what GDP “feels like” (usually round numbers that pundits can remember between 1 and 3), we use a modern mathematical model called a predictive tracking algorithm. And it’s been much more accurate than any alternative YTD.
That’s not to say that we’re certain we’ll nail the number again in Q3. That’s simply to remind you that people who didn’t use our growth and inflation numbers got nailed this year. Our #process, don’t forget, is grounded in embracing uncertainty.
As the trending data and macro market signals change, we do.
One of the biggest macro market factors that has not yet changed (but very well might, soon)... is finally establishing a series of higher-lows for long-term US interest rates. Here are some important and open questions that have uncertain answers:
- Heading into Noah’s flood, was last week’s 2.02% closing low for the US 10yr Treasury Yield THE LOW for 2017?
- If it was the low (in rates), was that the YTD high for Gold and related recipients of falling REAL RATES?
- If it was the low, was that the relative performance high for Utilities (XLU) vs. Financials (XLF) for 2017?
The best answer that a good, flexible, and objective risk management #process can provide you is, “I don’t know, yet… but I’ll get back to you as I receive more data and market signals.”
Or maybe that’s just the best I can do for you.
When I feel more certain, I haven’t had a central tendency to hide my conviction.
Our immediate-term Global Macro Risk Ranges (with intermediate-term TREND views in brackets) are now:
UST 10yr Yield 2.02-2.18% (bearish)
SPX 2 (bullish)
RUT 1 (bullish)
NASDAQ 6 (bullish)
VIX 9.95-12.69 (bearish)
USD 91.20-93.25 (bearish)
GBP/USD 1.29-1.32 (bullish)
Oil (WTI) 45.68-49.80 (bearish)
Gold 1 (bullish)
Best of luck out there today,
KM
Keith R. McCullough
Chief Executive Officer